 Forum
ForumCustomize Chart
You can configure each and every parameter of a chart and make it look like the way you want it to.
Chart Configuration Dialog
To open Chart Configuration Dialog right click on chart and select 'Configure Chart' in context menu.
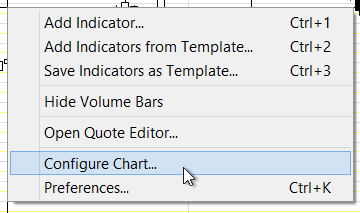
Chart Configuration Menu.
Margin, Background and Border
Go to General tab. In Margins section you can change the right inner margin of chart. In 'Colors and style' section you can change border-style, border-color, and background color of chart.
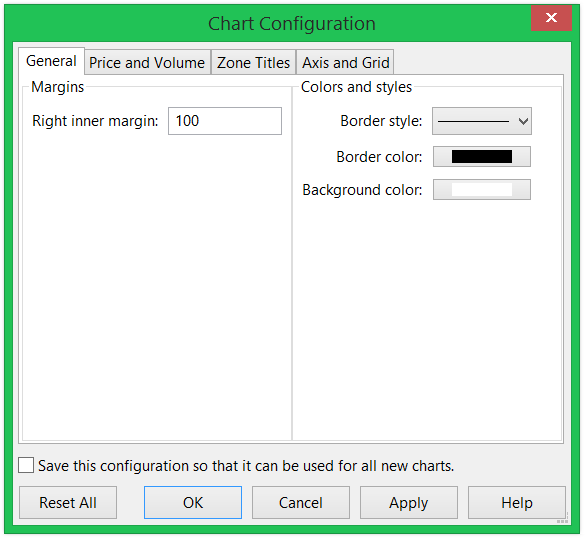
Chart Configuration - General.
Configuring Price and Volume objects
In 'Price and Volume' tab you can configure price and volume objects.
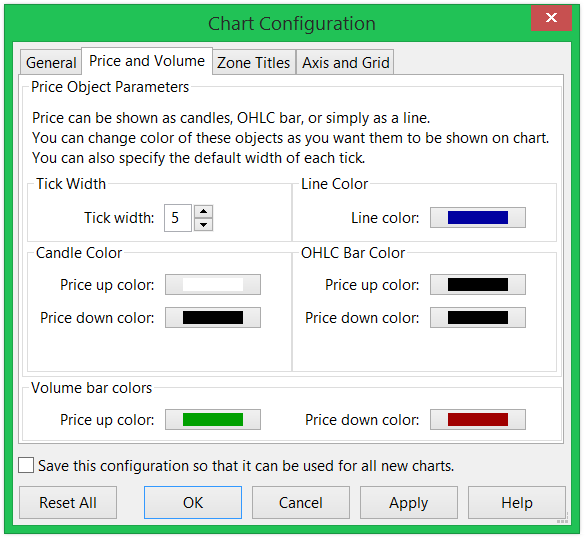
Chart Configuration - Price and Volume.
Configuring Zone Titles
A chart contains a main zone and it can contain one volume zone and many indicator zones. You can configure titles of all three types of zones and if you can make them look different. Go to 'Zone Titles' tab to configure zone titles.
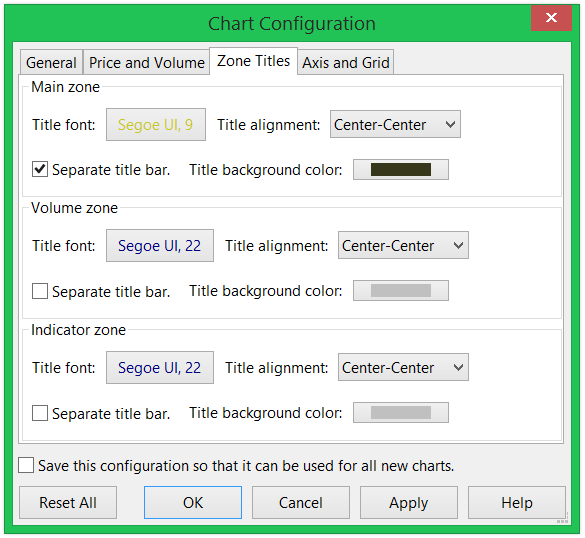
Chart Configuration - Zone Titles.
Note: To increase vertical space so that more indicator zones can fit in visible area of chart you can configure zones to not have title bar.
Configuring Axes and Grids
Go to 'Axis and Grid' tab to configure axes and grids.
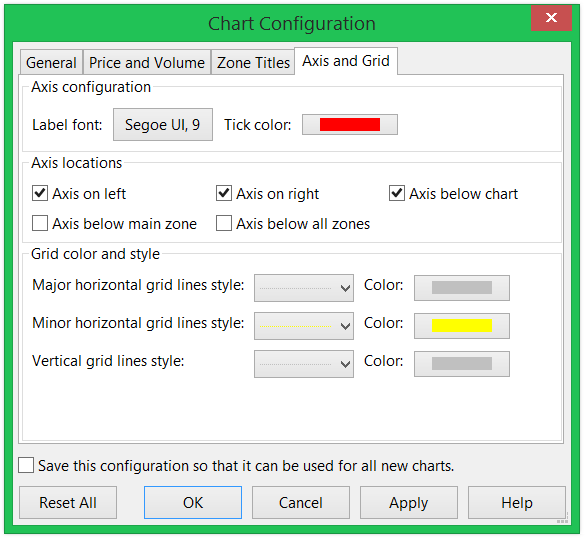
Chart Configuration - Axis and Grid.
 Stockalyze Help Manual