 Forum
ForumIndicator Selection Dialog
Indicator Selection Dialog appears when you need to select an indicator. For example when you want to add an indicator to chart or when you want to create a Trading System. Below is a snapshot of this dialog:
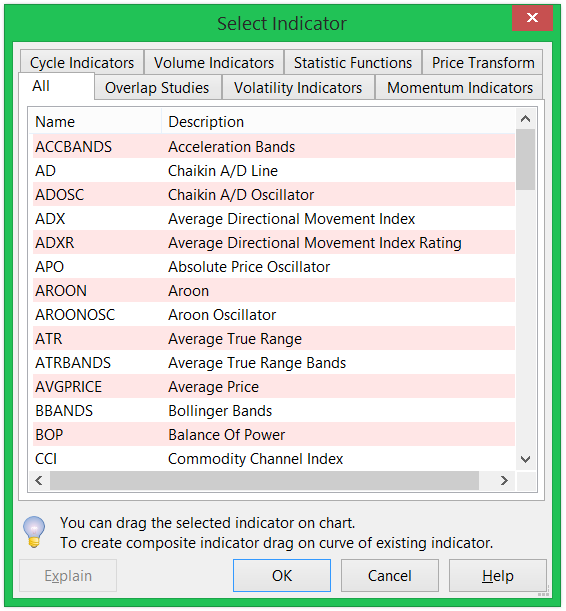
Indicator Selection Dialog
Indicator Selection Dialog contains list of all indicators that Stockalyze supports. All indicators are divided into multiple categories:
- Cyclic Indicators
- Volume Indicators
- Statistic Functions
- Price Transform
- Overlap Studies
- Volatility Indicators
- Momentum Indicators
The Explain button on Indicator Selection Dialog opens the Stockalyze Indicator Help document describing the selected indicator. It is a quick way to reach the indicator reference.
For illustration we will use MFI indicator. So, select MFI in Indicator Selection Dialog and click OK.
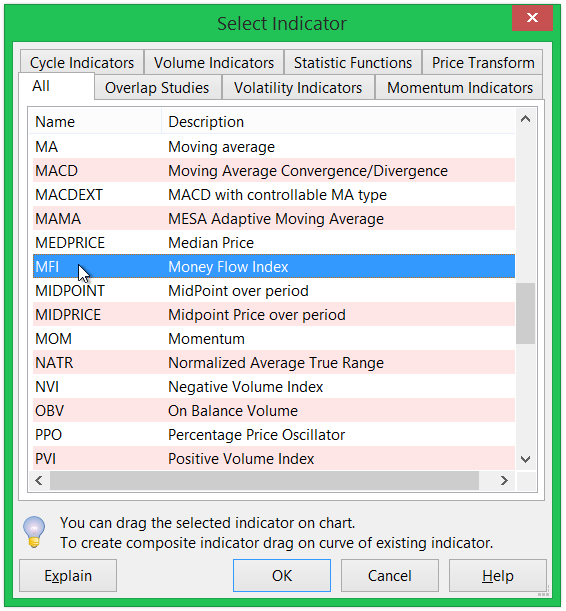
Indicator Selection Dialog with MFI
On clicking OK Indicator Configuration Dialog will appear.
Indicator Configuration
Indicator Configuration Dialog appears whenever you use an indicator, e.g. when adding an indicator to a chart, or using an indicator to define a Trading System. This dialog will also appear when you want to configure an already displayed indicator or modify an existing Trading System.
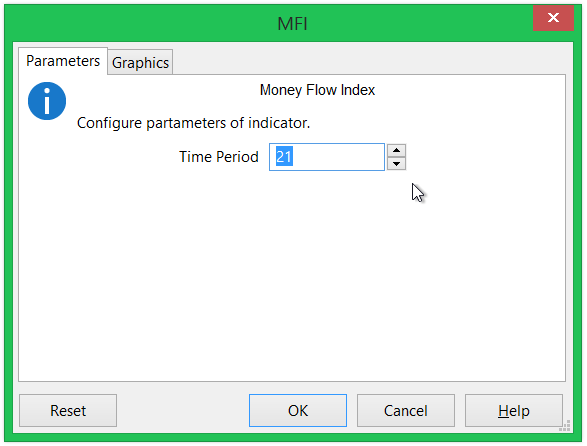
Configuring parameter of MFI.
In most cases you will just click OK and that will be sufficient. But
here we will learn how to configure an indicator if we want to.
While adding MFI to chart you will see two tabs in Indicator
Configuration Dialog. In some cases there will be
three tabs. First tab, i.e. Parameters
tab, is for parameters of indicator and second tab, i.e. Graphics
tab, is for defining graphics of indicator.
Indicator Parameters
When Indicator Configuration dialog appears the last used values or default values of parameters are already selected. If you wish to change the values of parameters then you can do so by modifying the values in Parameters tab. In this example we will change the Time Period of MFI to 21 as shown in above figure.
Indicator Graphics
In Graphics tab you can configure how an indicator
should be displayed.
Capability to configure indicator graphics is a very powerful
feature
of Stockalyze.
The default graphic configuration of MFI contains only a Solid Line as shown below:
MFI(21) without graphics configuration
We will add few graphics to MFI to make it more usable on chart. Configuring graphics depends on how an indicator is interpreted. For this example we will assume that MFI(21), i.e. 21 period MFI, triggers buy signal when it crosses 35 from below, and triggers sell signal when it crosses 65 from above. We will add following graphics to MFI(21):
- A red mountain object with MFI as cliff and base at 65. To highlight overbought period.
- A green inverted-mountain object with MFI as cliff and base at 35. To highlight oversold period.
- We will also add horizontal lines at 65 and 35 to emphasize limits of overbought and oversold zones.
The aim is to make MFI(21) look like below image:
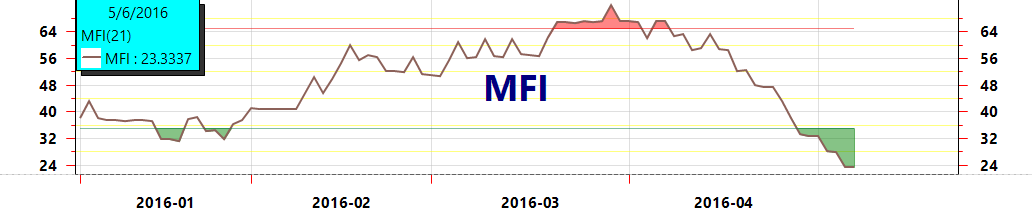
MFI(21) with graphics configuration
Now we will add graphic objects one by one to achieve a better configured MFI.
Add red mountain:
In the Graphics tab of Indicator Configuration Dialog click on Add and choose Mountain.
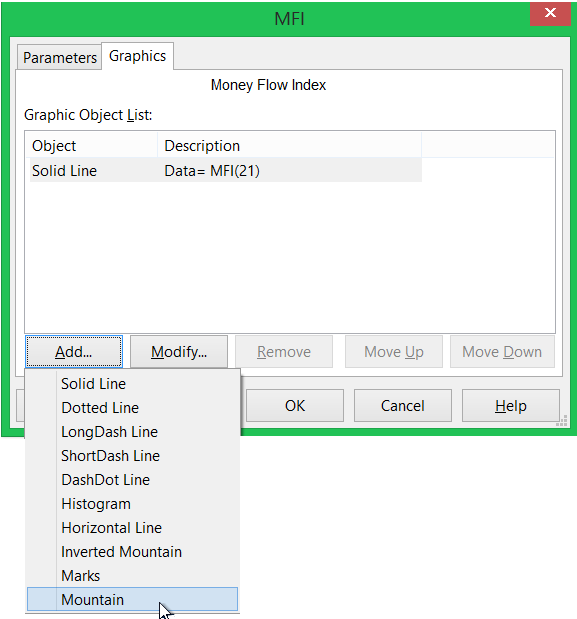
Add Mountain to MFI.
A dialog to Configure Mountain will appear. Configure Mountain Dialog has two tabs. In Mountain tab you need to supply the data that will make a mountain. Mountain needs a base and a cliff. Base should be a fixed value and cliff should be a data-series. Select the values as shown in below image.
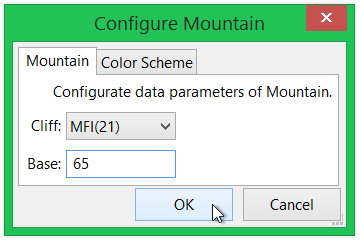
Configure Mountain Data.
In Color Scheme tab you need to supply data so that mountain is drawn in the color you want. In this case the mountain will be a single color object and so we just need to say that the color should be red. Supply the values as shown in below image.
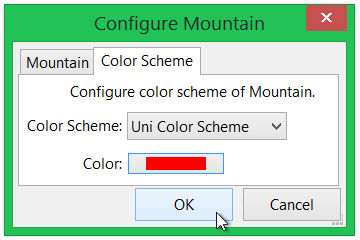
Configure Mountain Color.
Add Green Inverted Mountain:
Similarly add inverted mountain
- Click on 'Add' and choose 'Inverted Mountain'. A dialog to Configure Inverted Mountain will appear.
- Supply the values in Configure Inverted Mountain Dialog as you did while adding Mountain but make sure that the value of base is 35 and color is green.
Add two horizontal lines:
In the similar fashion you can also add horizontal lines at 35 and 65.
Below image shows the Graphics tab of Configuration Dialog after all
objects have been added.
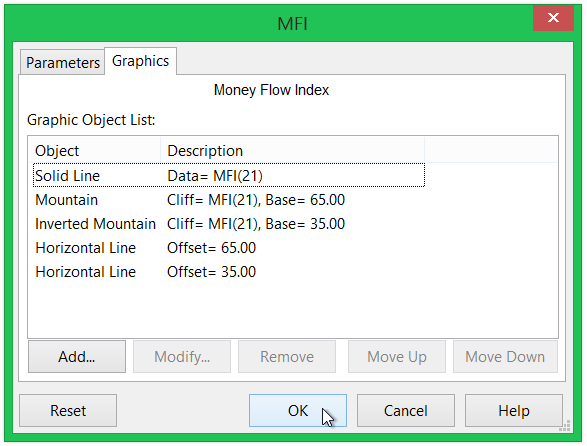
Graphics configuration of MFI.
Finally click OK on Indicator Configuration dialog to see the result.
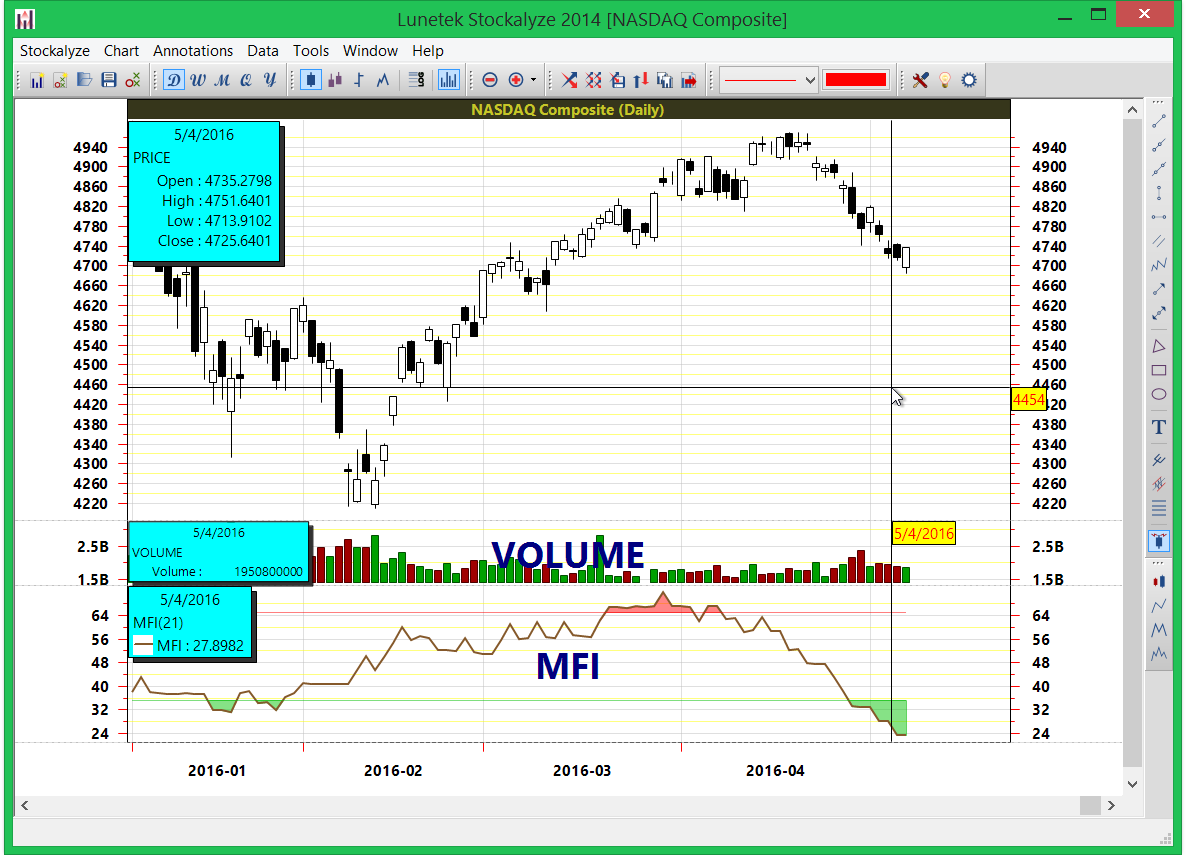
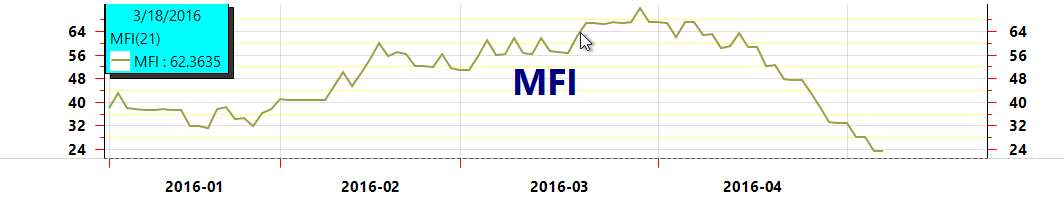
NASDAQ chart with configured MFI.
As it can be seen that MFI is now more visually "readable". Spotting overbought and oversold zones are extremely easy.
Read about Templates to know how to save indicators as template and reuse them instead of doing the above exercise again and again.
Also notice that we had changed the Time Period of MFI to 21, it is a non-standard value. But, if you think this can be a good value for some stocks then you can back test MFI(21) with lots of stocks to validate this hypothesis.
See Also
Trading Systems: Define Trading Systems for buy/sell strategy.Templates: Avoid adding same indicators manually each time you create a chart.
 Stockalyze Help Manual