Stockalyze Features
Powerful tools for investors and traders — from stock screening and backtesting to trading system design and portfolio analysis.
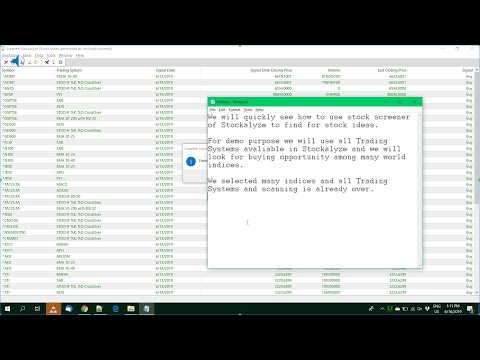
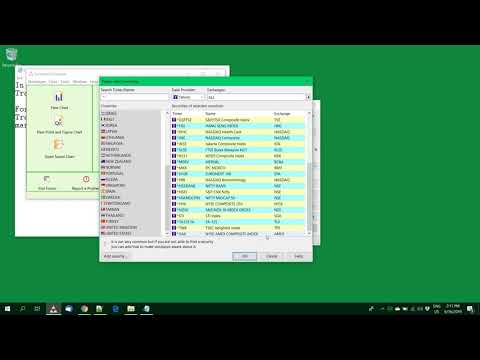
Stock Screener
Run stock screener and scan for stock ideas.
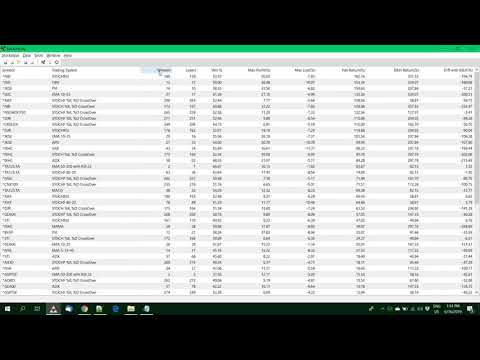
Prune scanned stocks
Prune stock ideas by backtesting scanned stocks.
Backtesting
Backtest Trading Systems on past data.
Buy-sell signals
Plot buy-sell signals on chart.
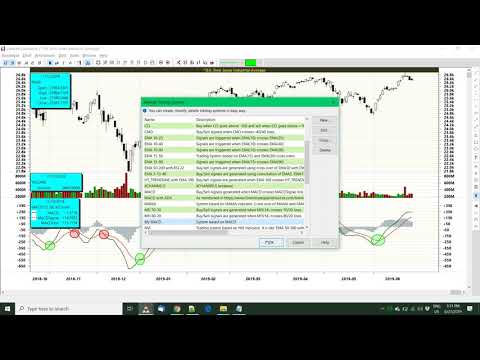
Trading System Editor
Visually create Trading Systems without formula.
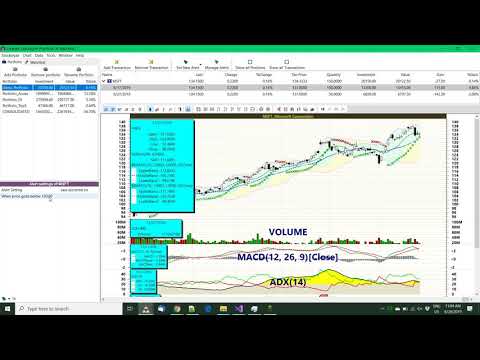
Portfolio and Watchlist
Manage portfolio and watchlist.
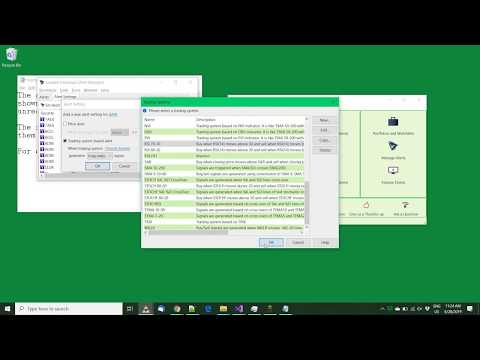
Alert System
Setup alerts and get notified.
Indicator of Indicator
Create indicator of indicator by drag-drop.
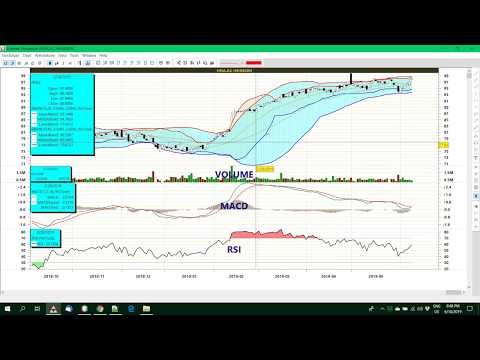
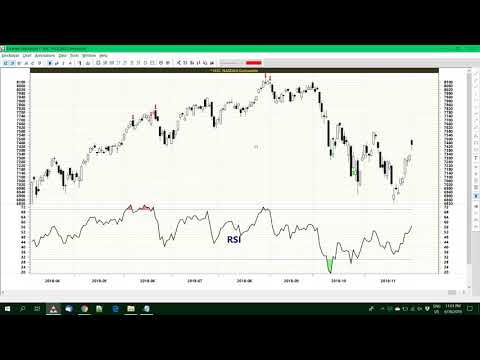
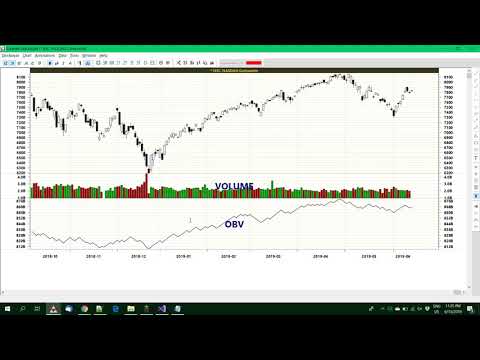
Technical stock charts
Create awesome stock charts.
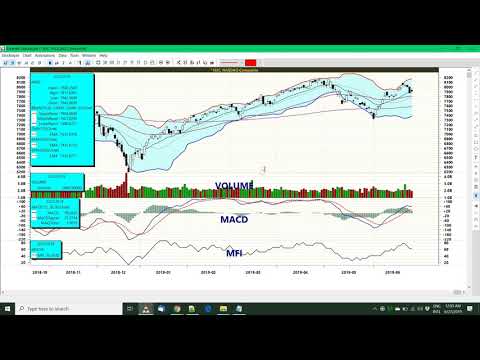
Chart Template
Setup template for easy stock charting.
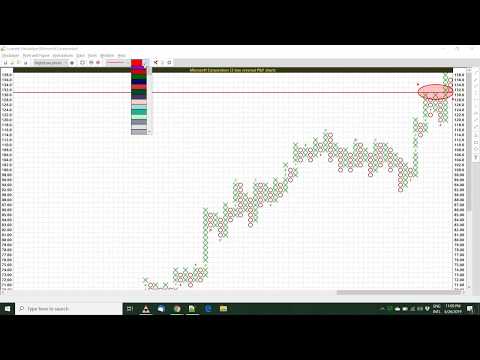
Point and Figure
Run stock screener and scan for stock ideas.
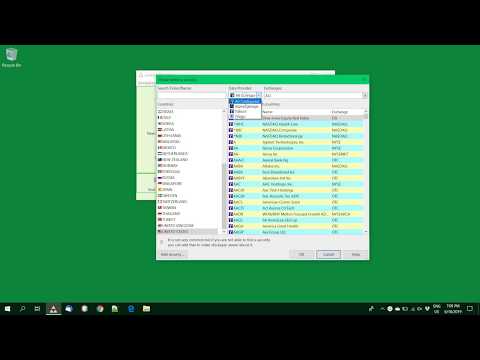
Tiingo data provider
Use data provided by Tiingo.