Candlestick pattern detection
Adding candlestick pattern detector to chart
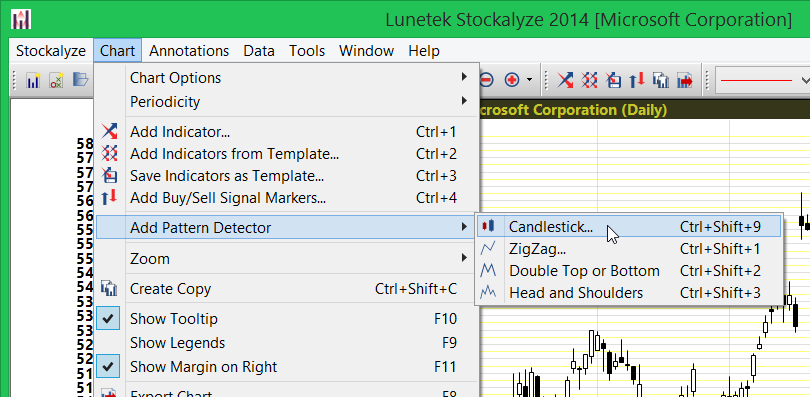
To detect candlestick pattern in a chart you need to first add detector to the chart. To add detector go to 'Chart->Add Pattern Detector->Candlestick':

Menu item to add candlestick pattern detector to chart.
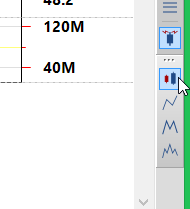
Alternatively, you can also click on 'Detect candlestick patterns' tool-button located on right side of chart:

Tool button to add candlestick pattern detector to chart.
Selecting patterns that needs to be detected:
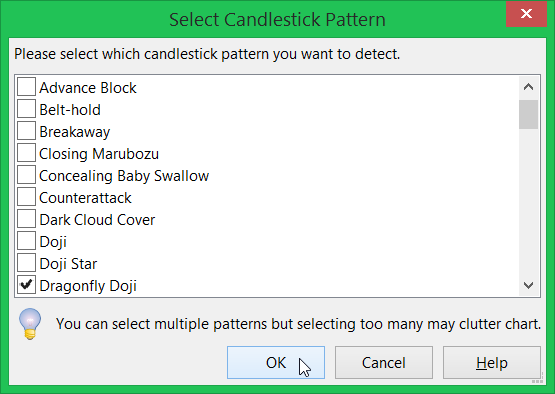
Clicking on above described menu item or tool button will show you a dialog box with list of possible candlestick patterns that Stockalyze is capable of detecting and the list is a long one.

Candlestick Pattern Selection dialog.
You can select as many candlestick pattern as you want and hit OK.
Example:
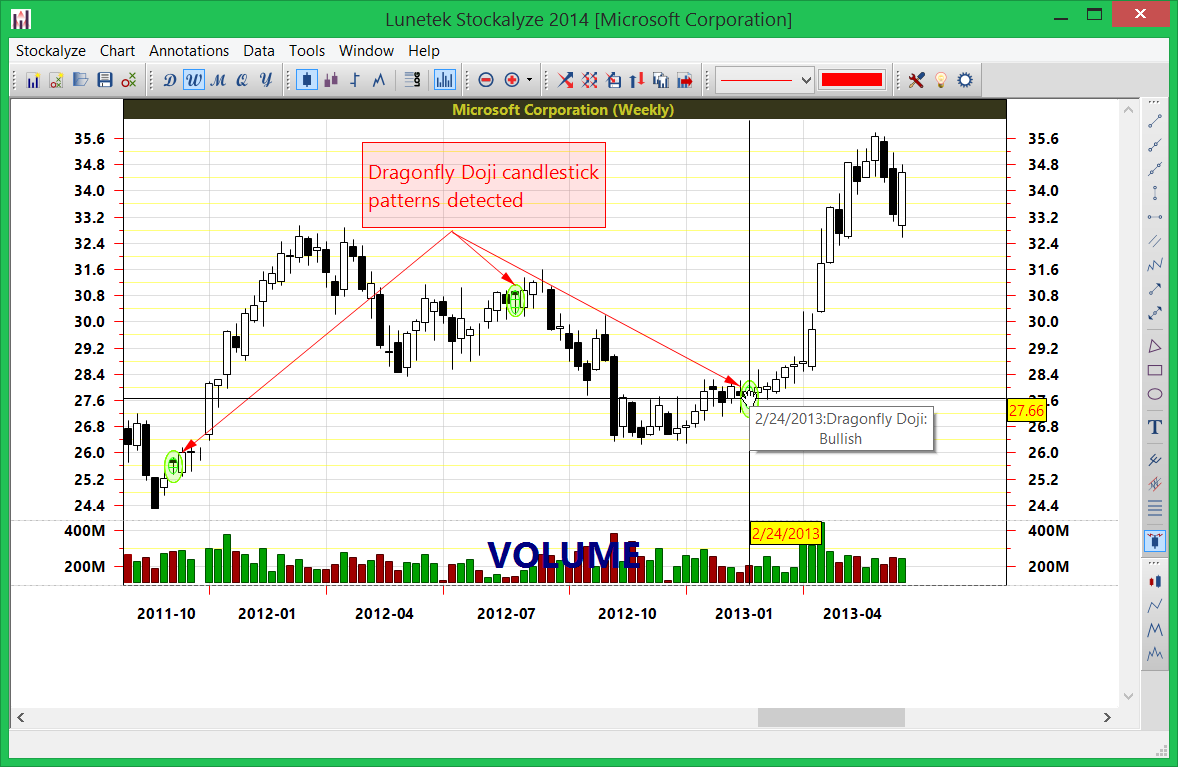
Below image shows 'Dragonfly Doji' pattern detection on Microsoft (NASDAQ:MSFT) chart.

Dragonfly Doji candlestick patterns detected on MSFT chart.
All detected patters are shown by green (bullish pattern) or red(bearish pattern) oval shapes drawn around price candle.
If you hover mouse cursor inside one of those oval shape then a tooltip will describe the patterns detected along with other price related data.
 Stockalyze Help Manual
 Forum
Forum