Condition Editor
The Condition Editor is a powerful tool in Stockalyze that allows you to define precise conditions for trading signals. It is used within the Trading System Editor to specify when buy, sell, short, or cover signals should be triggered.
Overview
A condition in a trading system checks whether specific relationships exist between price data and technical indicators. For example, you might want to trigger a buy signal when the MACD line crosses above the MACD Signal line, or when the price closes above a certain moving average.
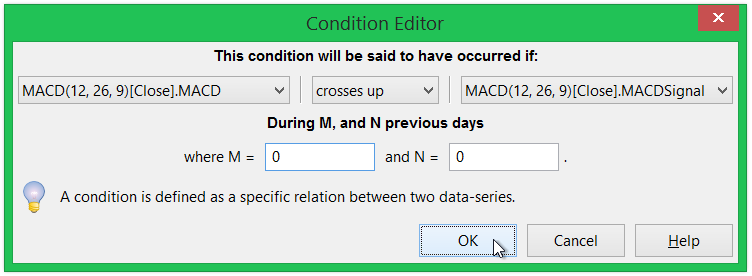
Condition Editor Dialog: Setting up a MACD Buy Signal condition.
Dialog Components
The Condition Editor dialog contains the following main elements:
Condition Type (Dropdown)
This dropdown lets you select what type of comparison or relationship to check:
| Condition Type | Description | Use Case |
|---|---|---|
| Cross Over Up | First series crosses above second series | MACD crossing above Signal line; price crossing above moving average |
| Cross Over Down | First series crosses below second series | Price crossing below support level; indicator trending downward |
| Greater Than | First series is greater than second series | Price above moving average; RSI above 50 |
| Less Than | First series is less than second series | Price below resistance; RSI below 30 |
First Series (Data Series)
Select the first data series to compare. Available options include:
- Price Fields: Open, High, Low, Close, Volume
- Indicator Outputs: Any technical indicator you've added to the trading system (MACD, RSI, EMA, etc.)
- Add Indicator: Click this option to add a new indicator to your trading system and use its outputs
Second Series (Comparison Value)
Select the value to compare against the first series. Available options include:
- Price Fields: Open, High, Low, Close, Volume
- Indicator Outputs: Outputs from any indicator in your trading system
- Fixed Values: Common preset values (0, 20, 30, 70, 80) for quick comparison
- Other Fixed Value: Enter any custom numeric value
- Add Indicator: Add a new indicator to use in the condition
Understanding Periods and Offsets
The period/offset fields control when in history the condition should be checked. This is one of the most important concepts in the Condition Editor.
What Does "During M and N Periods" Mean?
"During M and N periods" means the condition should be true at any point within a lookback range. You specify:
- M (Start): How many periods back to start looking
- N (End): How many periods back to stop looking
The condition is checked from M periods ago up to N periods ago (inclusive).
What is a "Period"?
A "period" depends on your chart's timeframe:
- Daily chart: 1 period = 1 day
- Weekly chart: 1 period = 1 week
- Monthly chart: 1 period = 1 month
- Hourly chart: 1 period = 1 hour
The same M and N values automatically apply to the correct timeframe unit. No special configuration is needed.
Practical Examples
Example 1: Recent Buy Signal (Most Common)
If you want the condition to be true anytime in the last 5 periods (including today):
Set M = 4 and N = 0
This checks: today (0), 1 period ago, 2 periods ago, 3 periods ago, 4 periods ago
Why M = 4? Because to check 5 periods including today, you need to go back 4 periods from today.
Example 2: Today Only (Most Frequent)
If you want the condition to check only the current period:
Set M = 0 and N = 0
This checks only the current bar
Example 3: Looking at Previous Period Only
If you want to check only the previous period's bar:
Set M = 1 and N = 1
This checks only 1 period back from today
Example 4: Last 5 Periods on Weekly Chart
If you're looking at a weekly chart and want to check if a condition was true in the last 5 weeks:
Set M = 4 and N = 0
On a weekly chart, this checks: this week, 1 week ago, 2 weeks ago, 3 weeks ago, 4 weeks ago
Example 5: Specific Range - Between 5 and 10 Periods Ago
If you want to check if the condition was true between 5 and 10 periods ago (excluding current period):
Set M = 10 and N = 5
This checks: 5, 6, 7, 8, 9, and 10 periods ago
For Comparison Conditions (Greater Than, Less Than)
When using comparison conditions (like "Greater Than" or "Less Than"), you'll see two separate offset fields labeled as X and Y in the dialog:
- X (First Series Offset): How many periods back to get the first value
- Y (Second Series Offset): How many periods back to get the second value
These offsets let you compare values from different points in time. A period offset of 0 means the current period, 1 means 1 period ago, 2 means 2 periods ago, and so on.
Example: Comparing Current vs Previous Period
If you set X = 0 and Y = 1, you're comparing the current period's value with the previous period's value. If you set both X = 5 and Y = 5, you're comparing values from exactly 5 periods ago (comparing the same point in time from the first and second series).
Practical Example: Rising Closing Price
One common use of X and Y offsets is to check if the closing price is rising (higher than the previous period). To create this condition:
- Select Condition: "Greater Than"
- Select First Series: Close (current price)
- Select Second Series: Close (previous price for comparison)
- Set X = 0 (get today's closing price)
- Set Y = 1 (get yesterday's closing price)
- Click OK
This creates the condition: "Close[0] > Close[1]" which means "today's close is greater than yesterday's close", indicating a rising price.
You can find a practical example of X and Y offset usage in the built-in trading system "Higher Timeframe Support Bounce (EMA)", which uses offsets to identify specific price action patterns across multiple timeframes. Examine this system in Stockalyze's Trading System Editor to see how professional trading systems leverage offset features.
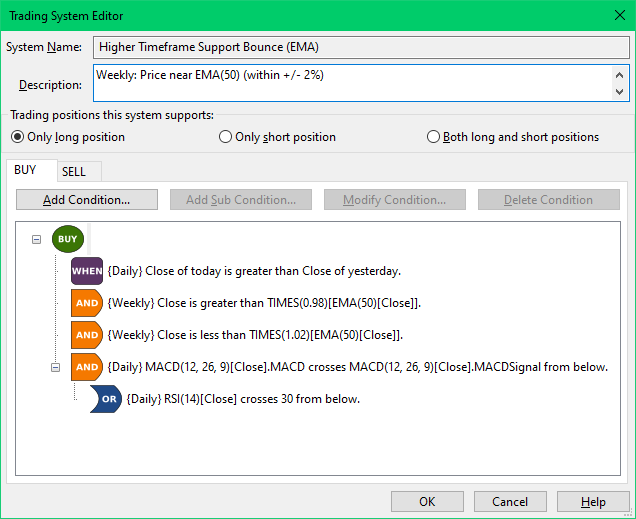
Higher Timeframe Support Bounce (EMA) Conditions.
The first condition of "Higher Timeframe Support Bounce (EMA)" is
{Daily} Close of today is greater than Close of yesterday.
Take a look at the Condition Editor to see how this is set up:
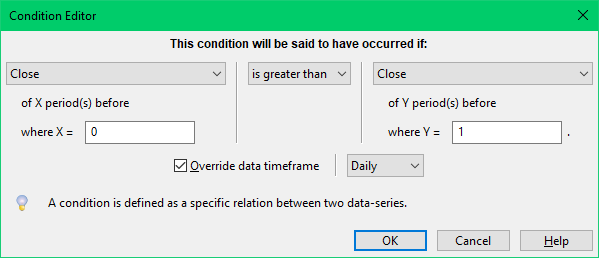
Higher Timeframe Support Bounce (EMA) Condition Editor Setup.
The set up is:
Condition: "Greater Than"
First Series: Close
Second Series: Close
X = 0 (current period)
Y = 1 (previous period)
Also notice that Override data timeframe is checked and Daily is selected,
allowing the condition to be
evaluated for the specified timeframe, i.e. Daily.
We learn more about timeframe override in the next section.
Timeframe Override
By default, conditions use the same timeframe as your trading system analysis (Daily, Weekly, Monthly, etc.). However, you can override this to create multi-timeframe conditions.
Why Use Timeframe Override?
Multi-timeframe analysis is powerful because it lets you:
- Define entry conditions on a daily chart while confirming with weekly trend
- Use monthly strength filters combined with daily opportunities
- Create more sophisticated trading rules based on multiple timeframe perspectives
How to Use:
- Check the "Override timeframe" checkbox
- Select the desired timeframe from the dropdown (Weekly, Monthly, etc.)
- The condition will now be evaluated on that timeframe
Practical Examples
Example 1: MACD Buy Signal (Crossover)
Create a buy signal when MACD crosses above the MACD Signal line:
- Select Condition: "Cross Over Up"
- Select First Series: MACD (from the MACD indicator)
- Select Second Series: MACDSignal (MACD Signal line)
- Set M = 0, N = 0 (check today only)
- Click OK
MACD Crossover Setup.
Example 2: Price Above Moving Average
Create a condition when closing price is above a 50-period EMA:
- Add EMA(50) indicator to your trading system
- Select Condition: "Greater Than"
- Select First Series: Close (price)
- Select Second Series: EMA50 (the moving average)
- Set X = 0, Y = 0 (compare current period values)
- Click OK
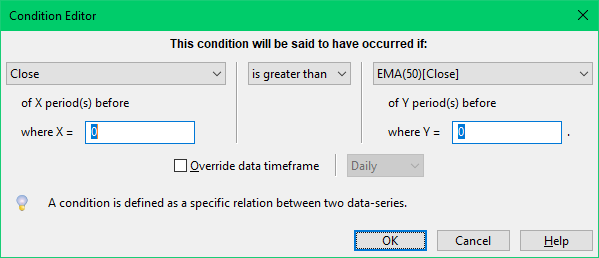
Price Above Moving Average (EMA-50) Setup.
Example 3: RSI Oversold Bounce
Create a condition for an RSI oversold bounce (RSI crosses over 30 from below in the last 3 periods):
- Add RSI(14) indicator to your trading system
- Select Condition: "Cross Over Up"
- Select First Series: RSI (from RSI indicator)
- Select Second Series: "Other fixed value" and enter "30"
- Set M = 3, N = 0 (check last 3 periods including current)
- Click OK
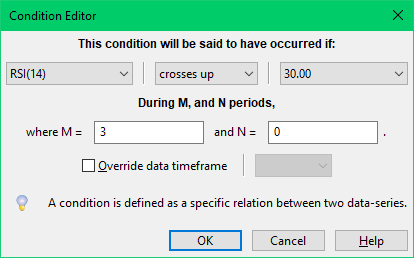
RSI Oversold Bounce Setup.
Tips and Best Practices
- Start Simple: Begin with simple conditions (M=0, N=0) before exploring complex lookback ranges.
- Test Your Conditions: Use the Backtest feature to verify your conditions generate the signals you expect.
- Use Fixed Values Wisely: Common RSI levels (20, 30, 70, 80) and other thresholds are pre-populated for quick access.
- Avoid Over-Complexity: More complex conditions don't necessarily lead to better trading systems. Keep conditions clear and testable.
- Document Your Logic: In the Trading System description, document why each condition exists. This helps future review and understanding.
- Multi-Timeframe Confirmation: Using the timeframe override feature can add strength to your signals by confirming them on higher timeframes.
Related Topics
- Trading Systems - Overview of trading systems and system editor
- Backtesting - Test your conditions and trading systems on historical data
- Stock Screener - Find stocks using your custom trading system conditions
 Stockalyze Help Manual