Trading Systems
A Trading System is a set of rules that define entry and exit of trading positions.
Stockalyze comes with many built-in Trading Systems. But if you want to define your own then you can use Trading System Editor to create new or modify existing Trading Systems.
In Stockalyze you can use simple graphical user interface (GUI) to define a Trading System. We will see this happening in just a while.
Manage Trading Systems
To manage Trading Systems, i.e. create, modify, delete, etc. click on Manage Trading Systems tool button on gateway window.
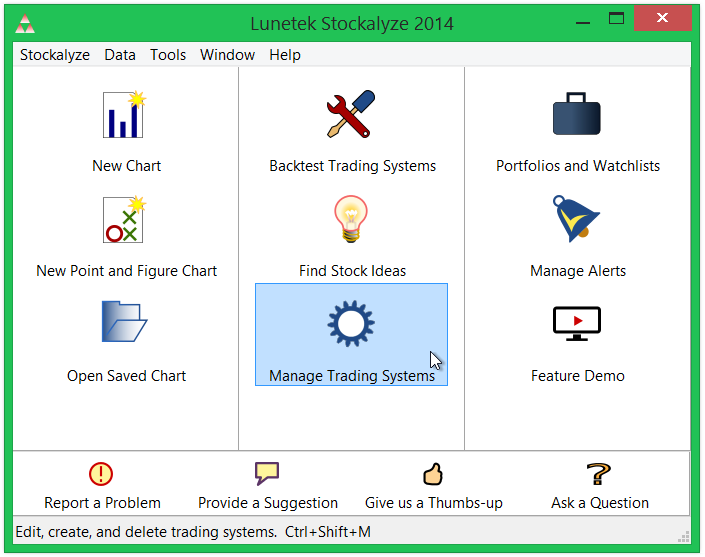
Manage Trading System tool button.
Or, alternatively go to Tools->Manage Trading Systems ... menu item as shown below.
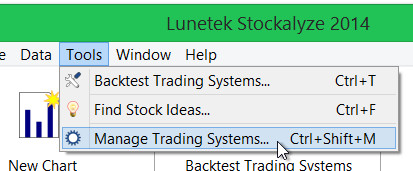
Trading Systems Menu.
Manage Trading Systems dialog
Manage Trading System dialog lists all Trading Systems that Stockalyze is aware of. You can add your own Trading System to this list.
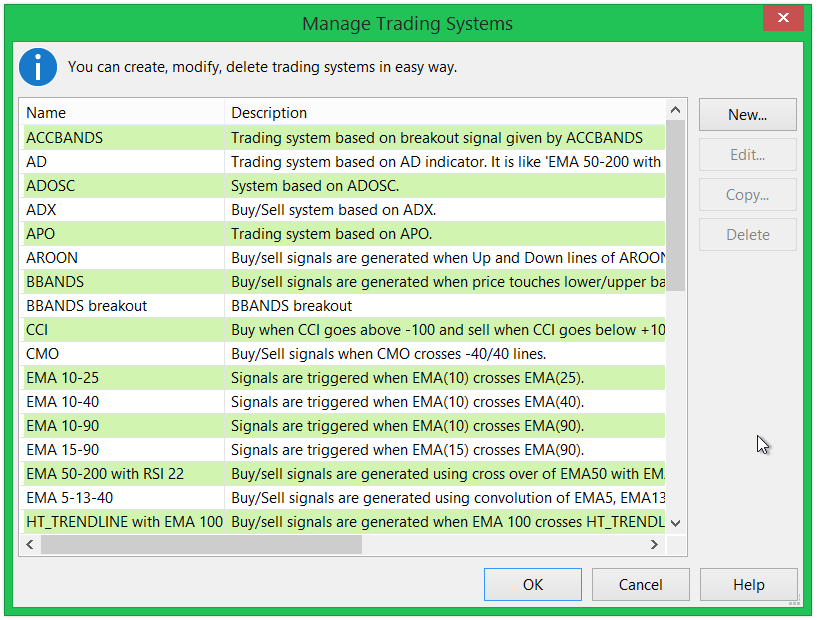
Manage Trading Systems dialog.
You will also see this dialog whenever you will want to use a Trading System. For example when using features like Signal Marker, Stock Screener, Back Test Trading System, etc.
In Manage Trading Systems dialog you can create new Trading System as well as modify or delete existing ones. You
can also copy existing ones and modify them to create variations.
Be caredful that if you modify or delete a built-in Trading System then they will be back in original form when
you update Stockalyze.
Built-in Trading Systems
Stockalyze comes with many built-in Trading Systems. These are provided for your convenience and to get you started with Trading Systems in Stockalyze. You can use these built-in Trading Systems as they are, or modify them to suit your needs, or create new ones from scratch.
Below are some of the built-in Trading Systems that come with Stockalyze:| Name | Type | Description |
|---|---|---|
| Crossover (Stochastic RSI) | Crossover | Signals are generated based on cross over of STOCHRSI. |
| Crossover (SMA 50/200) | Crossover | Signals are triggered when SMA(50) crosses SMA(200). |
| Crossover (EMA 15/90) | Crossover | Signals are triggered when EMA(15) crosses EMA(90). |
| Crossover (EMA 10/90) | Crossover | Signals are triggered when EMA(10) crosses EMA(90). |
| Crossover (EMA 10/40) | Crossover | Signals are triggered when EMA(10) crosses EMA(40). |
| Crossover (EMA 10/25) | Crossover | Signals are triggered when EMA(10) crosses EMA(25). |
| Crossover (MACD) | Crossover | Buy/Sell signals generated when MACD crosses signal line |
| Crossover (EMA 50/200 + RSI 22) | Crossover | Buy/sell signals are generated using EMA50/EMA200 crossover with RSI22. |
| Crossover (TEMA 5/20) | Crossover | Signals are generated based on cross overs of TEMA5 and TEMA20. |
| Crossover (TEMA 10/90) | Crossover | Signals are generated based on cross overs of TEMA10 and TEMA90. |
| Crossover (Stochastic %K/%D) | Crossover | Signals are generated when %K and %D lines cross over. |
| Crossover (Stochastic Fast %K/%D) | Crossover | Signals are generated when %K and %D lines of fast stochastic cross over each other. |
| Adaptive Crossover (MAMA) | Adaptive Crossover | Cross over of MAMA and FAMA lines generate buy/sell signals. |
| Trend (Accumulation/Distribution) | Trend | Trading system based on AD indicator. |
| Trend (On Balance Volume) | Trend | Trading system based on OBV indicator. |
| Trend (Negative Volume Index) | Trend | Trading system based on NVI indicator. |
| Trend (Positive Volume Index) | Trend | Trading system based on PVI indicator. |
| Trend (HT Trendline + EMA 100) | Trend | Buy/sell signals are generated when EMA 100 crosses HT_TRENDLINE. |
| Trend (Parabolic SAR) | Trend | Buy when closing price moves above SAR and sell when closing price moves below SAR. |
| Trend (ADX) | Trend | Buy/Sell system based on ADX. |
| Trend (Aroon) | Trend | Buy/sell signals are generated when Up and Down lines of AROON 25 cross over. |
| Trend Alignment (SMA 9/50/80) | Trend Alignment | Buy/sell signals are generated using SMA alignment. |
| Trend Alignment (EMA 5/13/40) | Trend Alignment | Buy/Sell signals are generated using EMA alignment. |
| Momentum (TRIX) | Momentum | Trading system based on TRIX |
| Momentum (APO) | Momentum | Trading system based on APO. |
| Momentum (ADOSC) | Momentum | System based on ADOSC. |
| Momentum (Williams %R) | Momentum | Buy/Sell signals are generated when WILLR crosses -80/-20 lines. |
| Momentum (CMO) | Momentum | Buy/Sell signals when CMO crosses -40/40 lines. |
| Momentum (CCI) | Momentum | Buy when CCI goes above -100 and sell when CCI goes below +100. |
| Momentum Reversal (Stochastic Fast 80/20) | Momentum Reversal | Buy when STOCHF moves above 20 and sell when STOCHF moves below 80. |
| Momentum Reversal (Stochastic 80/20) | Momentum Reversal | Buy when STOCH moves above 20 and sell when STOCH moves below 80. |
| Momentum Reversal (RSI 80/20) | Momentum Reversal | Buy when RSI(14) moves above 20 and sell when RSI(14) moves below 80. |
| Momentum Reversal (MFI 80/20) | Momentum Reversal | Buy/Sell signals are generated when MFI crosses 80/20. |
| Momentum Reversal (MFI 70/30) | Momentum Reversal | Buy/Sell signals are generated when MFI crosses 70/30. |
| Momentum Reversal (RSI 70/30) | Momentum Reversal | Buy when RSI(14) moves above 30 and sell when RSI(14) moves below 70. |
| Breakout (Keltner Channels) | Breakout | KCHANNELS breakout. |
| Breakout (Bollinger Bands) | Breakout | BBANDS breakout |
| Breakout (Acceleration Bands) | Breakout | Trading system based on breakout signal given by ACCBANDS |
| Mean Reversion (Bollinger Bands) | Mean Reversion | Buy/sell signals are generated when price touches lower/upper bands. |
| Multi Timeframe RSI Reversal (Early Entry) | Multi Timeframe | Weekly RSI < 40 (weak) Daily RSI crosses above 30 |
| Multi Timeframe Momentum (RSI Stack) | Multi Timeframe | Monthly RSI > 60 Weekly RSI > 60 Daily RSI > 60 |
| Multi Timeframe Volatility Breakout (Bollinger Bands) | Multi Timeframe | Weekly: Uptrend Daily: BBANDS squeeze + breakout |
| Higher Timeframe Support Bounce (EMA) | Multi Timeframe | Weekly: Price near EMA(50) (within +/- 2%) Daily: Bullish crossover / RSI bounce |
| Multi Timeframe RSI Regime Pullback | Multi Timeframe | Weekly RSI > 50 -> bullish regime Daily RSI dips to 40 and bounces |
| Multi Timeframe Breakout (Trend Filter) | Multi Timeframe | Weekly: RSI > 60 or price > EMA(50) Exit when close breaks below EMA or 10 days low Daily: Close > Highest High (20) |
| Multi Timeframe Trend Alignment (EMA) | Multi Timeframe | Monthly: Close > EMA(50) Weekly: Close > EMA(50) Daily: Close crosses EMA(50) |
| Multi Timeframe Pullback (RSI) | Multi Timeframe | Buy when Monthly RSI >60 and Weekly RSI > 60 and Daily RSI < 40 Sell when RSI > 70 |
| Multi Timeframe Pullback (EMA) | Multi Timeframe | Buy when Weekly trend is up and Daily price recovers from pullback above EMA20 Sell when price falls below EMA20 |
| Multi Timeframe MACD Confirmation | Multi Timeframe | Buy when Weekly MACD is bullish and Daily MACD gives entry signal Sell when Daily MACD turns bearish |
| Multi Timeframe Mean Reversion (RSI) | Multi Timeframe | Buy dips in uptrend using RSI Sell when RSI recovers |
Creating a new Trading System
We will now learn how to add a new Trading System with an example.
In Stockalyze you can create custom Trading Systems using the no-code Trading System Editor.
We will follow an example to create a new Trading System.
Example
We will create a Trading System based on MACD which is simple enough to get started with Trading Systems in Stockalyze. Trading System editor in Stockalyze is a powerful feature and you can develop pretty complex Trading Systems by using graphical interface only. In this example we will be developing a simple Trading System to learn the basics.
Before we continue let's first finalize the definition of our MACD based Trading System.
- Name of Trading System will be MyMACD.
- Trading System will support only long positions, i.e. only buy and sell, and no short and cover.
- Buy will be triggered when MACD crosses MACDSignal line from below.
- Sell will be triggered when MACD crosses MACDSignal line from above.
Since we want to create a Trading System based on MACD it is recommended that you read about MACD in Stockalyze Indicators Help document or read it on wikipedia to know more about it .
Steps to define Trading System
We will create a new Trading System as per definition above. To expedite learning we will focus on creating the Trading System by simply following the steps. We will go in detail later to understand it further.
Steps to follow to define the Trading System for this example:
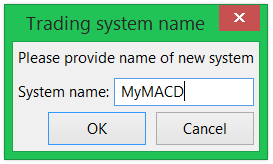
- Click New... on Manage Trading Systems dialog and
in the dialog that appears enter MyMACD as name and click OK.
 This will open Trading System Editor dialog where precise definition of Trading System can be provided.
Create new Trading System.
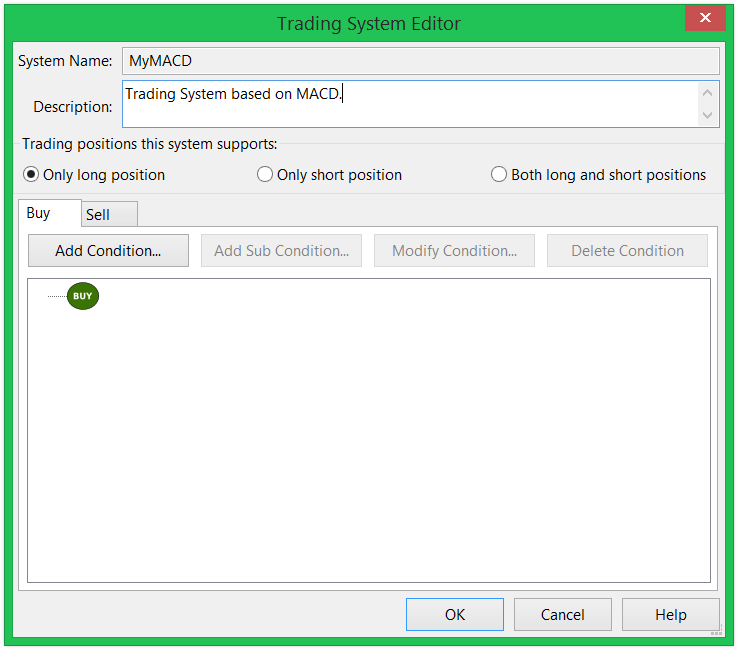
Trading System Editor.
- Type "Trading System based on MACD indicator." without the quotes in Description field.
- Click on Only long position.
- Click on Add Condition... button. It will open a Condition Editor dialog.
- Click on first drop-down of this dialog and then click on Add
indicator:
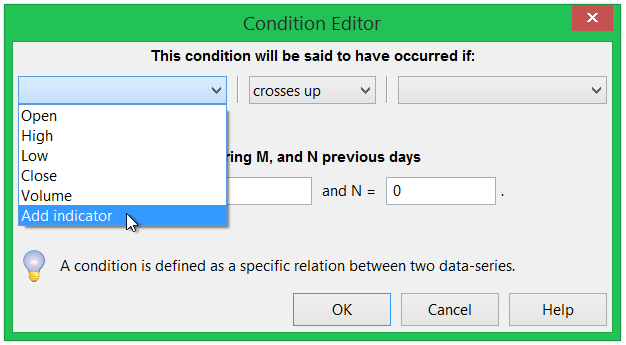
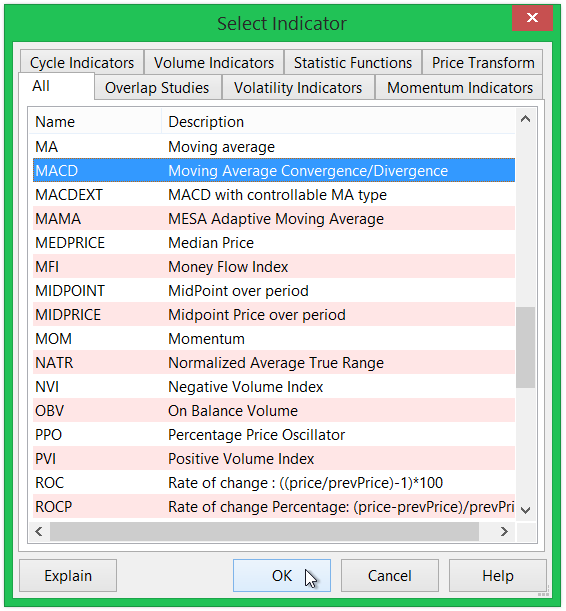
Condition Editor Dialog to add indicator in data list.
It will open Indicator Selection Dialog. - Select MACD in Indicator Selection Dialog and click OK. Again click OK on next dialog that appears.
- Now select items in second and third drop-down as shown below, and
then click OK:
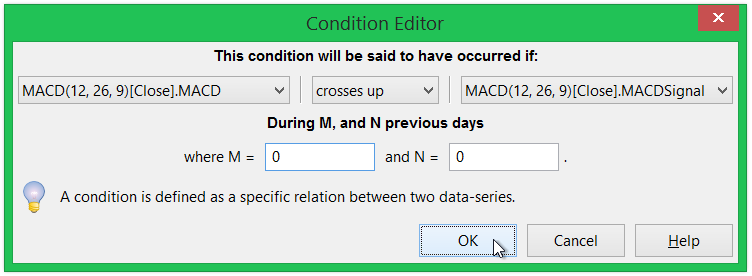
Condition Editor Dialog: MACD Buy Signal.
We will leave the remaining fields as default. To know more about the Condition Editor, refer to the Condition Editor section.
After that the Trading System Editor dialog will look like following:
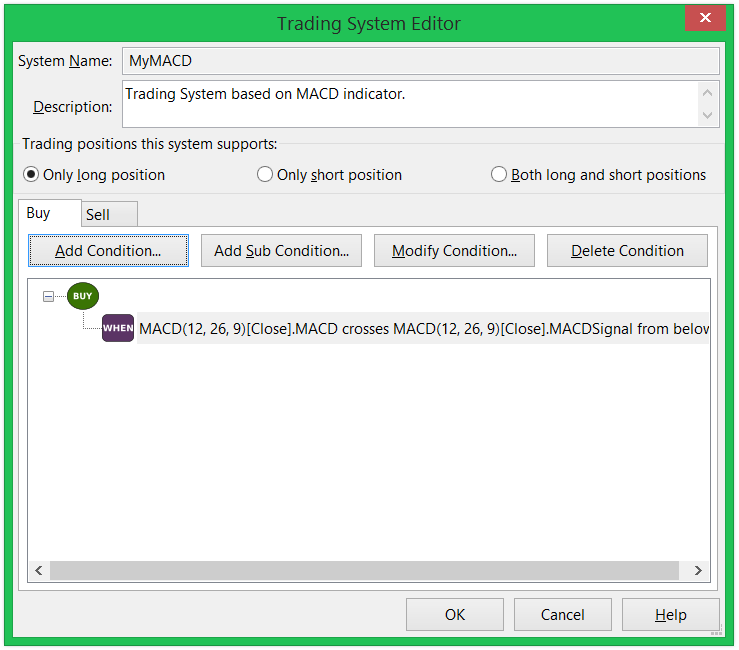
Buy signal definition of MyMACD Trading System.
- Now activate Sell tab and click on Add
Condition... again, and select items such that the
Condition Editor dialog looks like below image:
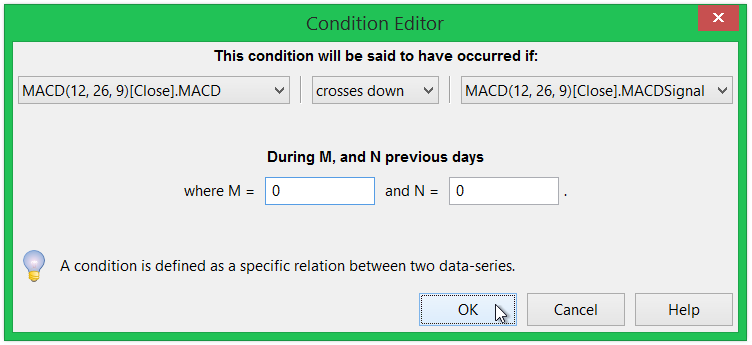
Condition Editor Dialog: MACD Sell Signal.
- Click OK. After this the Trading System Editor dialog will look like
below image:
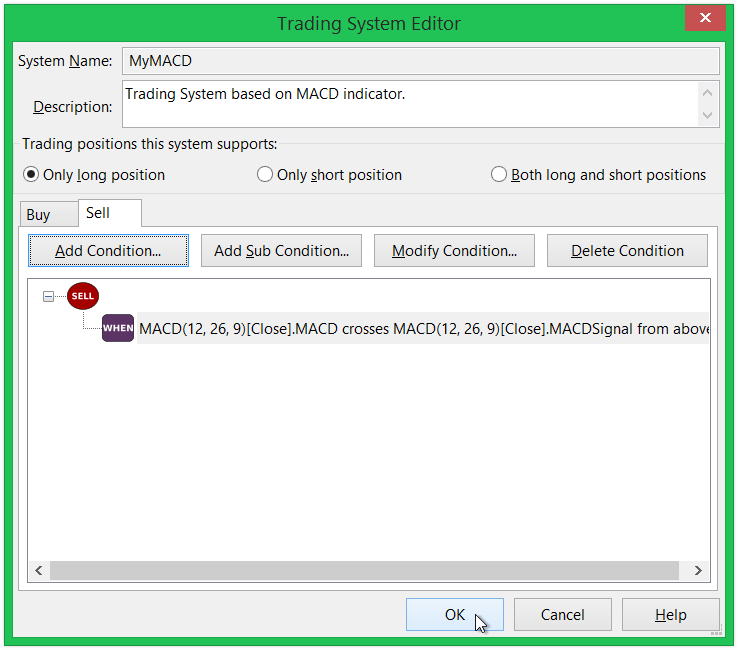
Sell signal definition of MyMACD Trading System.
- Click OK and you have just created your own Trading System based on
MACD:
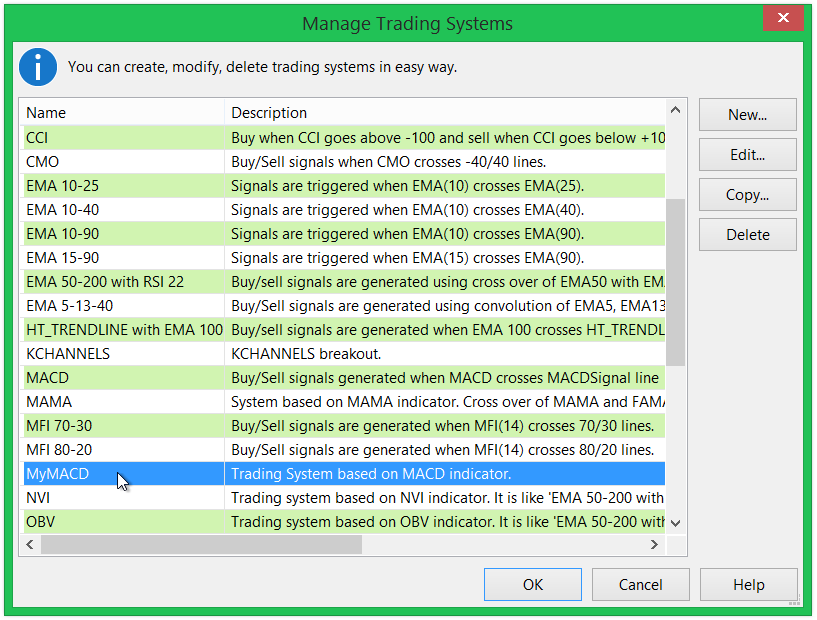
MyMACD Trading System in the list.
Add MACD outputs as data-series for defining condition.
Understanding Condition Logic: AND and OR Relationships
The Trading System Editor provides two buttons for building conditions: Add Condition and Add Sub Condition. Understanding how these buttons work is essential for creating accurate trading signals.
How "Add Condition" Works
Add Condition creates a new condition at the same level in the condition tree. All conditions created at the same level (sibling conditions) are connected with AND logic. This means that all sibling conditions must be true for the signal to trigger.
Example: If you have three conditions at the same level:
- Condition A: MACD crosses above signal line
- Condition B: RSI is above 30
- Condition C: Price is above 50-day moving average
The signal will only trigger when ALL THREE conditions (A AND B AND C) are true.
How "Add Sub Condition" Works
Add Sub Condition creates a child condition under the currently selected condition in the tree. These child conditions represent OR logic. Child conditions are graphically shown as indented items beneath their parent condition in the tree view.
When a condition has children:
- The child conditions are first evaluated with AND logic among themselves
- The result is then ORed with the parent condition
Condition Evaluation Logic
To better understand how conditions are evaluated, consider this example:
Parent Condition (P): MACD > Signal Line
Child Condition 1 (C1): RSI is above 30
Child Condition 2 (C2): Stochastic is above 20
This structure evaluates as: (C1 AND C2) OR P
The signal triggers when:
- Both C1 AND C2 are true, OR
- P is true
Practical Example: Building Complex Signals
Here's how you might build a more sophisticated signal using both types of conditions:
Buy Signal Structure:
Condition 1: MACD crosses above Signal Line (AND)
Sub Condition 1.1: RSI is above 30 (child)
Sub Condition 1.2: Stochastic is above 20 (child)
Condition 2: Price is above 50-day moving average (AND)
This evaluates as: ((RSI > 30 AND Stochastic > 20) OR MACD Crossover) AND (Price > MA50)
The buy signal triggers when:
- Both momentum indicators (RSI AND Stochastic) are in bullish territory, OR MACD gives a crossover signal
- AND the price is above the 50-day moving average
Tips for Building Conditions
- Use Add Condition when you want to add requirements that must all be satisfied (AND logic)
- Use Add Sub Condition when you want to provide alternative ways to trigger a signal (OR logic)
- You can nest multiple levels of sub conditions to create sophisticated trading rules
- The condition tree visually represents the logical structure of your trading signal
- Test your conditions with historical data using the Backtest feature to verify they work as intended
Now this newly born Trading System can be used to find stock ideas using Stock
Screener, Backtest with multiple
securities, and also other useful things.
 Stockalyze Help Manual