Stock Chart
Stock Chart introduction
Stock Chart creation
To create stock chart click 'New Chart' on gateway window of Stockalyze.
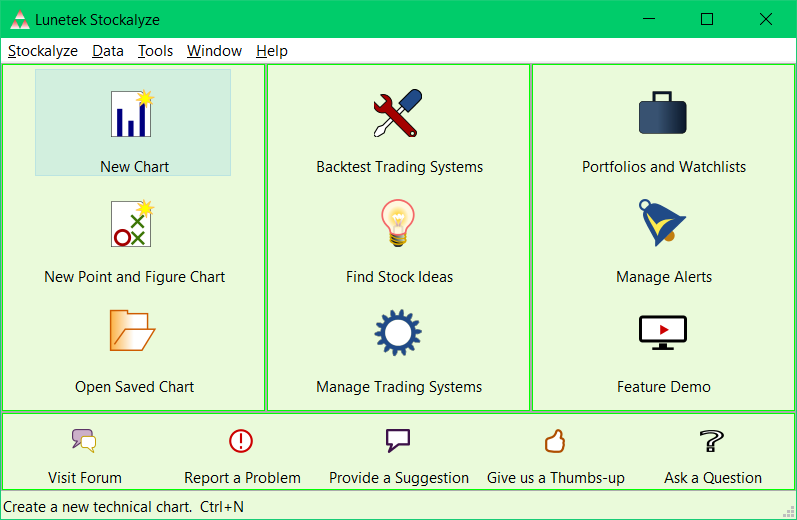
New Stock Chart tool button
After clicking on 'New Chart' the Security
Selection Dialog appears. As an example we will create stock chart of NASDAQ
for illustration. Type nasdaq in 'Search
Ticker/Name' field present towards top-left corner of this dialog.
To follow this example make sure UNITED STATES is
selected in the list of countries.
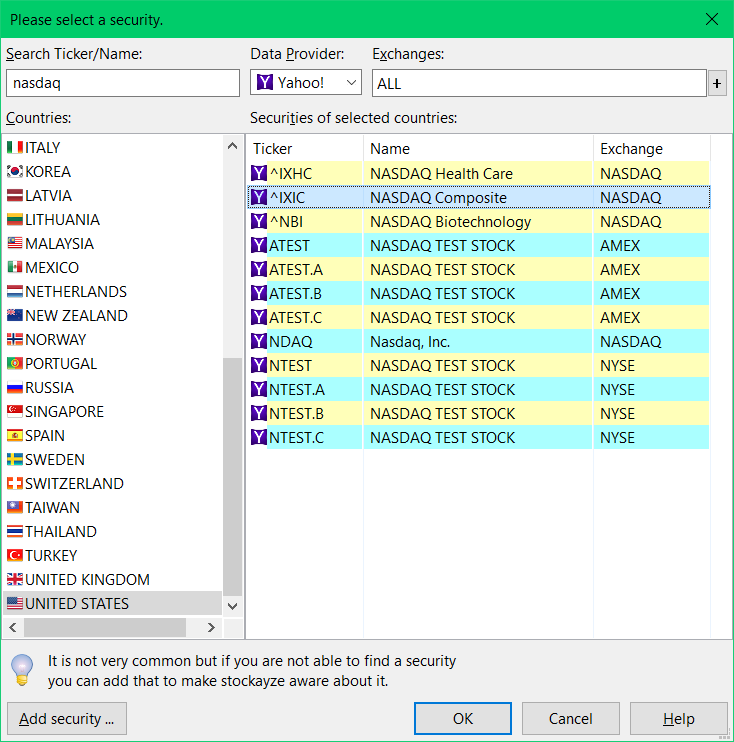
Searching symbol of NASDAQ
The newly created stock chart will be a basic technical chart, i.e. without any indicators, unless you have set a default template.
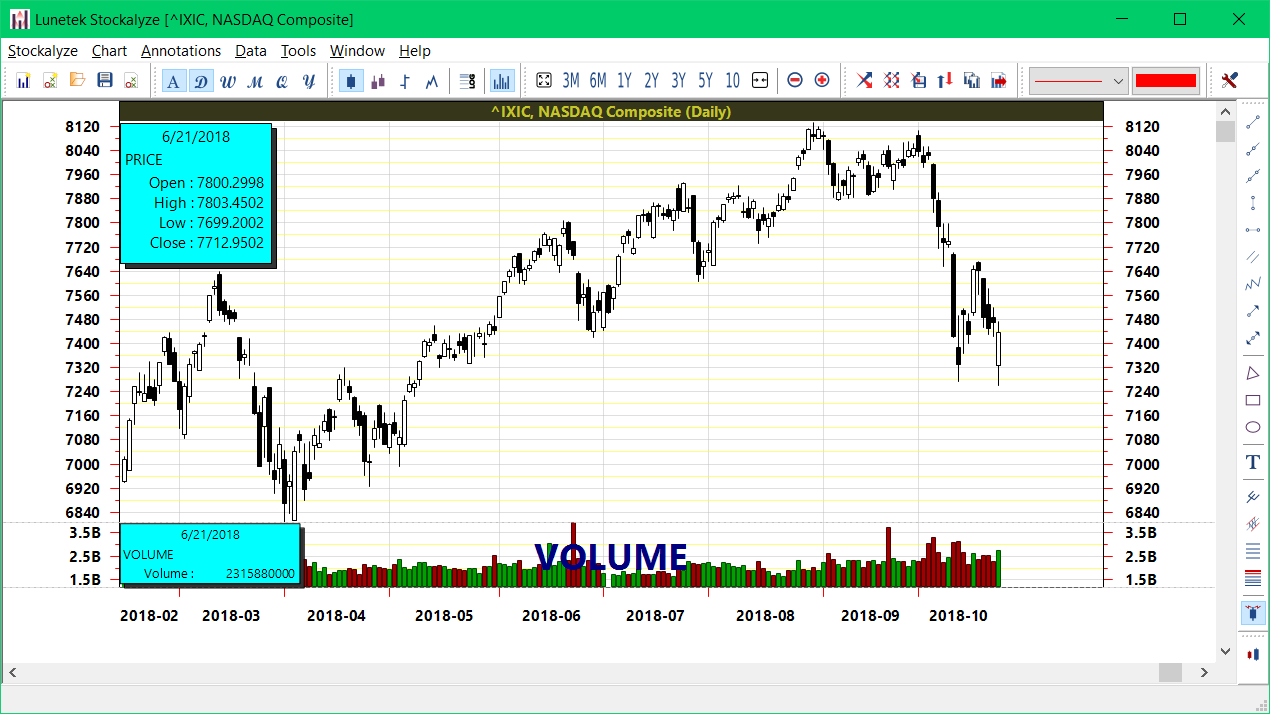
Basic technical stock chart of NASDAQ in Stockalyze.
If it is the first time the chart of NASDAQ is created in Stockalyze then internet connection is a must. Stockalyze will automatically download required data. If internet connection is not present then Stockalyze may still show the chart if the same security was used in Stockalyze before but the chart may not show the updated data.
Once a basic technical stock chart is created you can add indicators, patterns, annotations, signal markers, etc. to the chart as part of analyzing a stock.
Stock Chart Periodicity aka Timeframe
It helps to analyze stocks in multiple periodicity (or timeframes). For End-Of-Day stock charts Stockalyze supports Auto, Daily, Weekly, Monthly, Quarterly, and Yearly periodicity. To change chart periodicity click on desired tool button of periodicity toolbar.
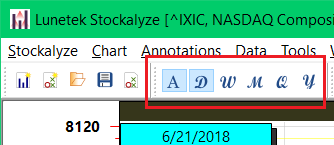
Stock Chart periodicity (or chart timeframe) toolbar.
By default the Auto periodicity is selected. Auto periodicity automatically chooses the best periodicity based on available screen width and zoom level of chart.
Stock Chart Zoom Level
Stockalyze provides ability to change zoom level of stock chart to customize the look to your own style.
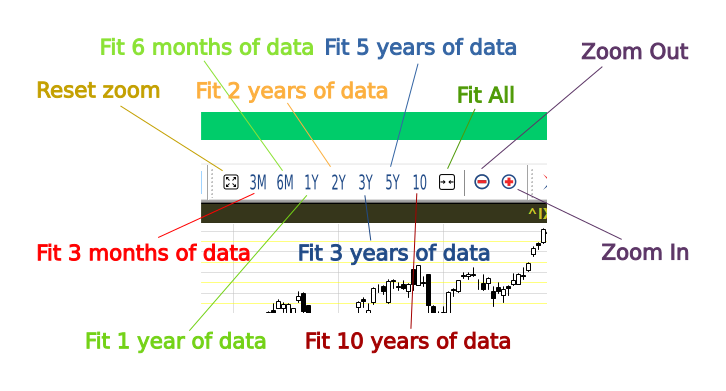
Stock Chart zoom level explained.
You can decide how much data you want to see on the screen. For example if you want to see just one year of data on chart then click 1Y.
You will have roughly one year of data in the visible area of chart. You can still scroll
to see other data but the range of data in visible area will be roughly of 1 year.
Same is the case for other zoom levels, you can choose the range of data in visible area of the chart.
You can also do incremental zoom-in and zoom-out.
If Auto periodicity is selected then changing zoom level
may cause different periodicity getting selected automatically, depending on available screen width and data.
Try clicking 1Y (or more) with Auto periodicity and observe that the periodicity changes to weekly.
Technical Indicators
Technical Indicators are the backbones of Technical Analysis. They are basically mathematical calculations based on historical price and volume movement. The aim of technical indicators are to forecast possible direction of a security which typically can be a stock or share. Stockalyze supports a battery of technical indicators which are fully configurable. You can create indicator of indicator too by simple drag and drop.Stock Chart Technical Indicator
To add technical indicator to a stock chart go to 'Chart->Add Indicator...' menu item or hit Ctrl+1.
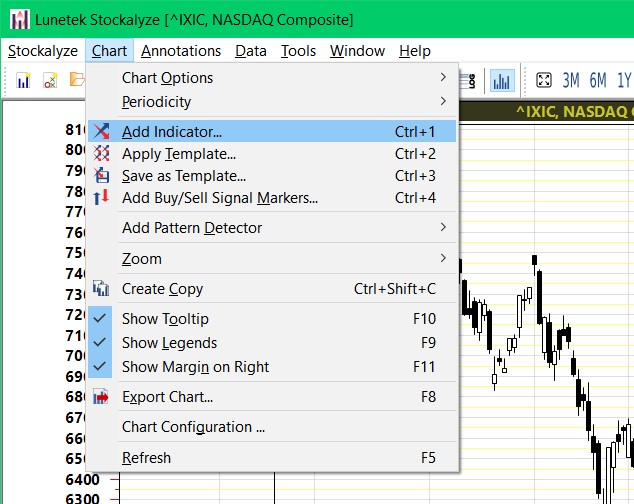
Menu item to add indicator to stock chart
After that an Indicator Selection Dialog will appear where you can choose the technical indicator you want to add to your stock chart.
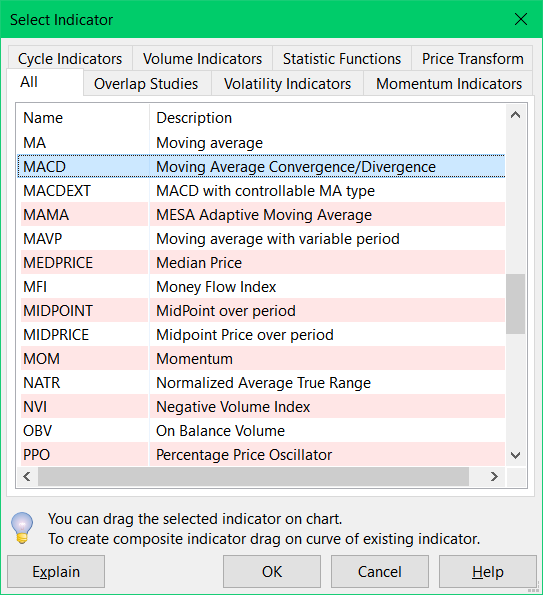
Indicator Selection Dialog
For illustration we will add MACD to the stock chart. In the Indicator Selection Dialog select MACD and click OK. Indicator MACD is present in Momentum Indicators tab. Once you select an indicator and click OK then Indicator Configuration Dialog will appear where you can change the parameters and graphics of the indicator.
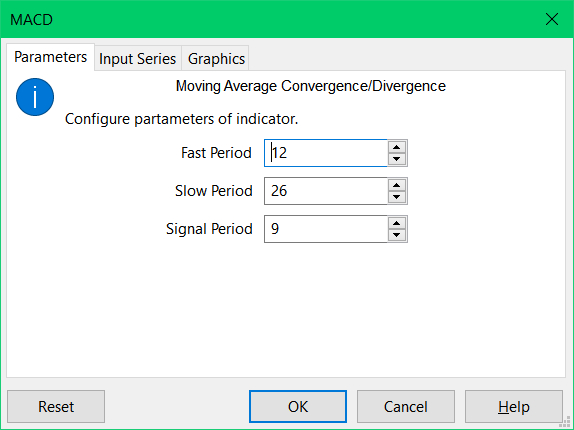
MACD default configuration
You can read more about Indicator Configuration Dialog. But in this illustration we will leave these things unchanged and just click OK, that will add MACD to the chart.
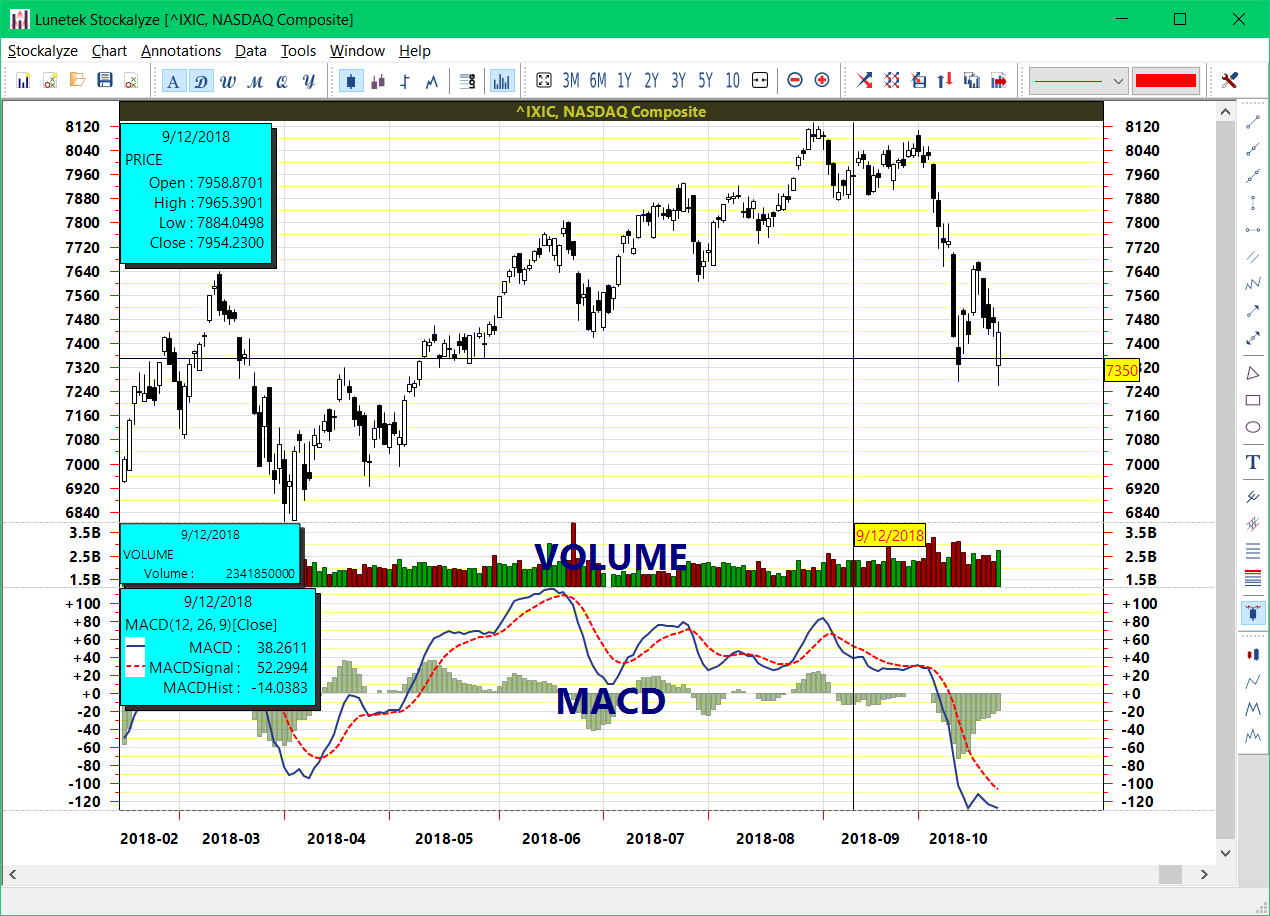
Stock Chart of NASDAQ with MACD.
That's it. It is that simple to add an indicator to a chart. You can add limitless number of indicators. You can even create templates of indicators so that you don't need to add your favorite indicators each time you create a chart.
Indicator of Indicator
At times we want to create indicator of indicator. In Stockalyze there are 2 ways to create indicator of indicator on a chart:
- By dragging an indicator from indicator selection dialog
- By configuring indicator to take input from output of another indicator
Composing indicator of indicator by drag-drop
Watch this lightning video demonstrates to quickly know how to plot technical indicator of another indicator on stock chart.
If we look at the bottom of indicator selection dialog we see a tip:
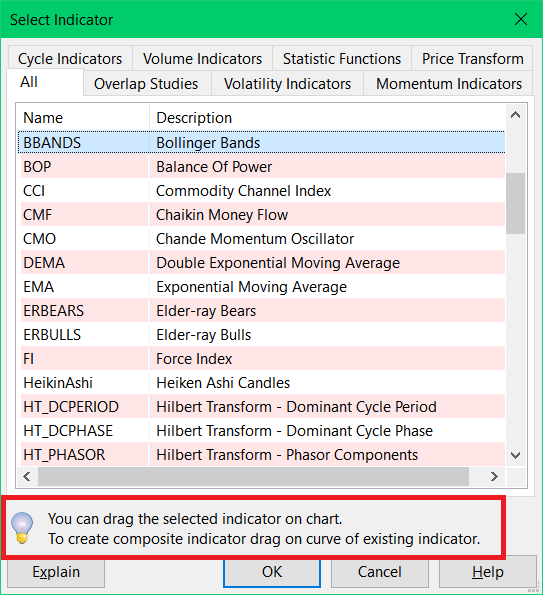
Indicator selection dialog with highlighted tip.
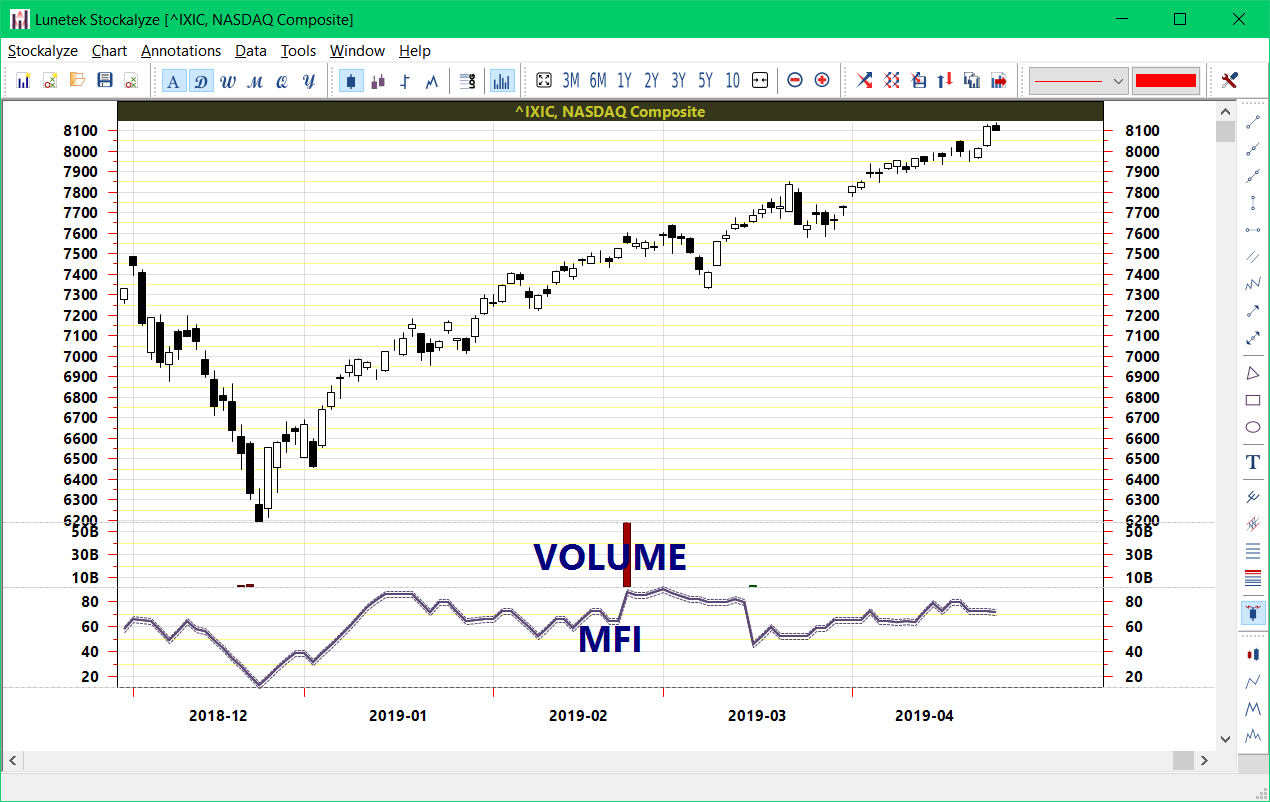
MFI with highlighted curve.
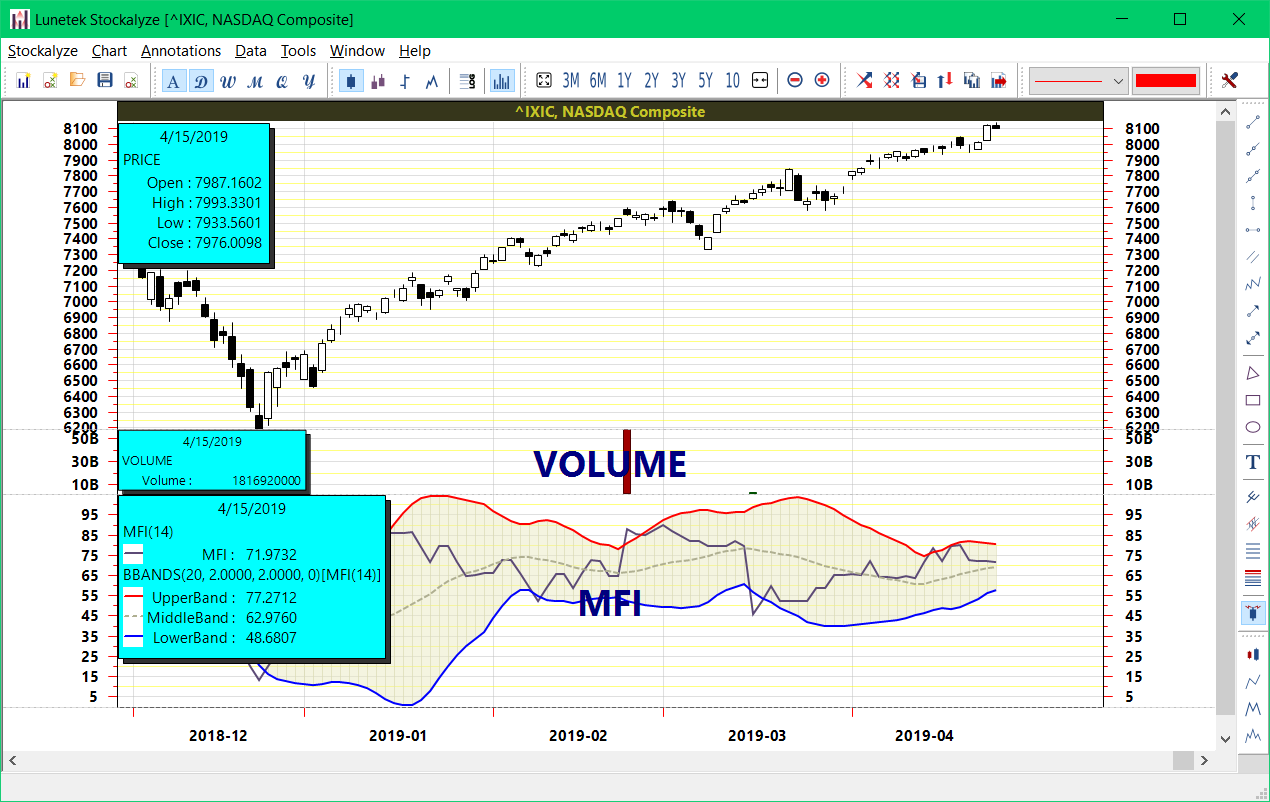
MFI with Bollinger Bands.
Composing indicator of indicator by configuring input series
In this method the input series of indicator can be set in Indicator Configuration Dialog that appears when an indicator is selected in Indicator Selection Dialog. This method of composing indicator of indicator is useful when indicator is needed in cases other than charts. For example when we want to create a Trading System that uses indicator of indicator. We will see this method in detail when we define Trading System.Stock Chart Templates
Stockalyze has a utility feature called Templates. In most cases when you draw a technical stock chart you also draw some fixed indicators. So, instead of adding one indicator at a time you can apply a template on a chart which will add many indicators in one go. You can also set a template as default so that when a new stock chart is created it is created with all your favorite technical indicators intact. Template has another benefit too, if you configure an indicator then you can save that as a template and apply that template to add the configured indicator, instead of configuring the indicator each time you use that.
Creating Template
Create a stock chart and add the technical indicators that you want to create template for. You can also change the size of zones as per your preference and also add patterns to he stock chart. After you are done with modifying the chart with indicators and pattern then save the template. To save template go to 'Chart->Save Indicators as Template ...' menu item.
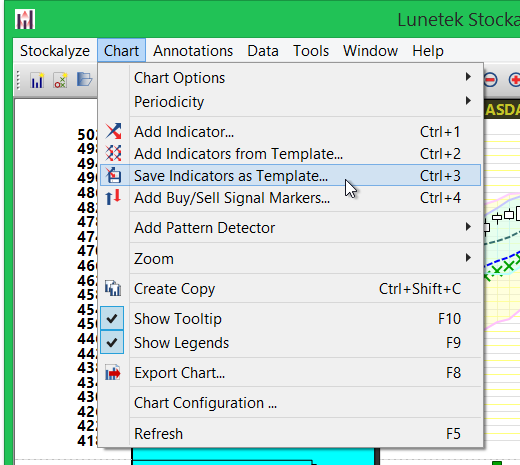
Save Stock Chart Template menu item.
In the file-dialog that appears choose the right name and location where the template file should be saved. You can later use this file to apply template on other stock charts.
Applying Template
Go to 'Chart->Add Indicator from Template ...'.
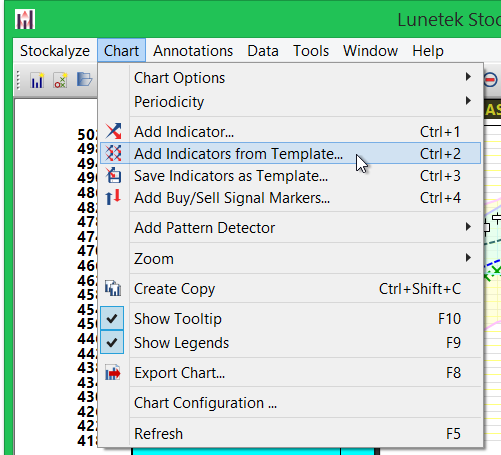
Add Indicator from Template menu item.
Locate and select the template file in the file-dialog that appears. All indicators described in the template will get added to the stock chart.
Default Template
You can also make a template default so that when any stock chart is created it appears with the template applied. You can specify the default template in preference dialog.
Stock Chart Annotations
When a stock chart is opened you can annotate it using various annotation objects. At present following annotations are supported:
| Annotation | Description |
| Trend Line | A Trend Line is a line segment with fixed end points |
| Ray | Ray is a line that extends in both direction infinitely and so it does not have any fixed point. |
| Extended Line | Extended Line is a line that is fixed at one point and extends infinitely on other end. |
| Vertical Line | Vertical Line extends infinitely in both direction but it is always vertical. |
| Horizontal Line | Horizontal Line extends infinitely in both direction but it is always horizontal. |
| Parallel Lines | Parallel Lines are bunch of parallel Trend Lines. |
| Connected Lines | Connected Lines are bunch of Trend Lines connected at end points. It is like drawing zigzag manually on chart. |
| Arrow | A trend line with arrow on one end. |
| Both Ways Arrow | A trend line with arrows on both ends. |
| Triangle | A translucent triangle with opaque edge. |
| Rectangle | A translucent rectangle with opaque edge. |
| Oval | A translucent ellipse with opaque edge. |
| Text | You can add texts on chart. |
| Andrew's Pitch Fork | Andrew's Pitch fork is used to detect early when price breaks from a trend. |
| Linear regression | Linear regression can be used to see the trend and create channel within which price moves. |
| Fibonacci retracements | Fibonacci retracements can be used to predict support/resistance levels. |
Adding annotation to stock chart:
To add an annotation to stock chart select the suitable menu item in Annotation menu:
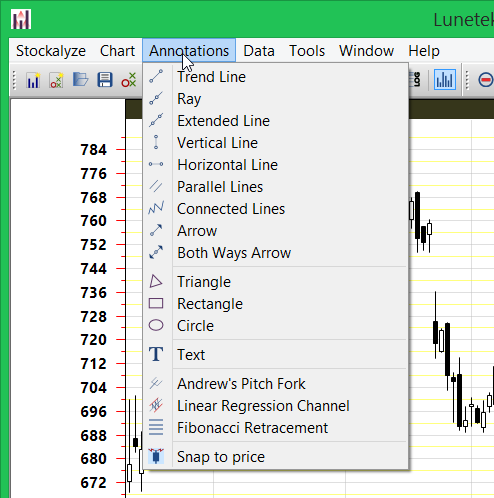
Annotation Menu.
Alternatively, you can click on desired tool button on right side of chart:
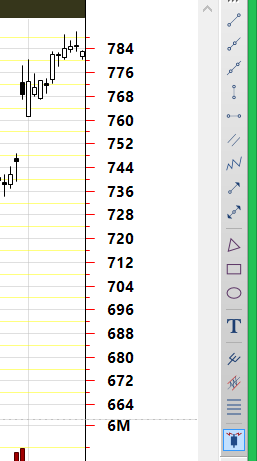
Annotation Toolbar.
After selecting the desired tool button or menu item you can click on the chart where you want to add the annotation, depending on annotation object selected you may need to click at multiple places to provide required number of data to finish creating the annotation.
Example:
Look at the image below for an example of annotation. Fibonacci Retracements and few Oval annotations have been added to GOOG chart:
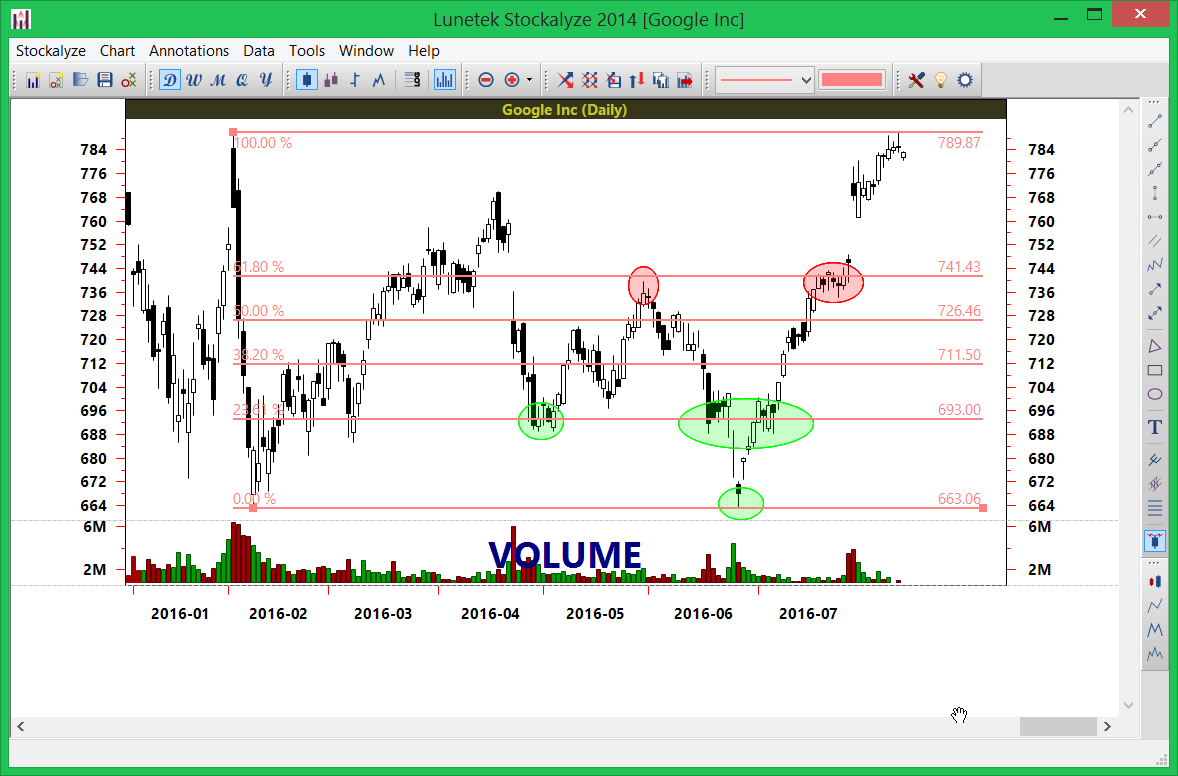
Fibonacci retracements with GOOG.
Likewise you can add as many annotation to a chart as you want and save the chart or export it as image.
Stock Chart Pattern Detection
Stockalyze provides facility to detect patterns in price movements. As of now following patterns can be automatically detected:
- Zigzag
- Double top and double bottom
- Head and shoulders and inverted head and shoulders
Pattern detector can be added to a stock chart by selecting 'Chart->Add Pattern Detector' menu item.
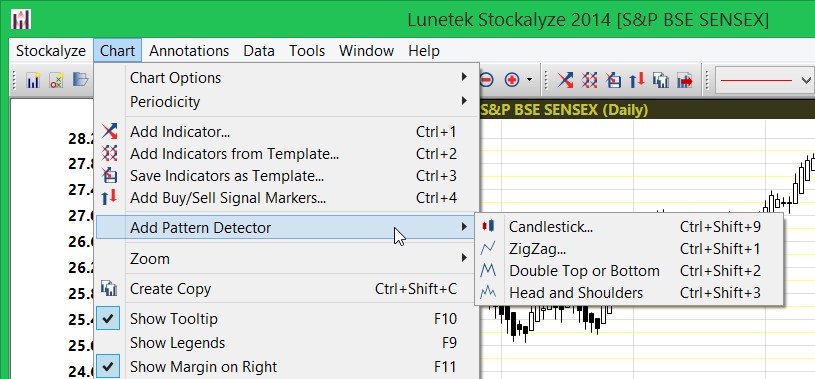
Menu item to add pattern detector to stock chart.
Zigzag:
Zigzag pattern is useful in visualizing price movement since it ignores minor fluctuation in price movement and so it makes pattern emerge out of seemingly chaotic movement in stock prices.
Example:
Look at below image showing zigzag pattern (zigzag-2.5%) in stock price movement of AAPL.
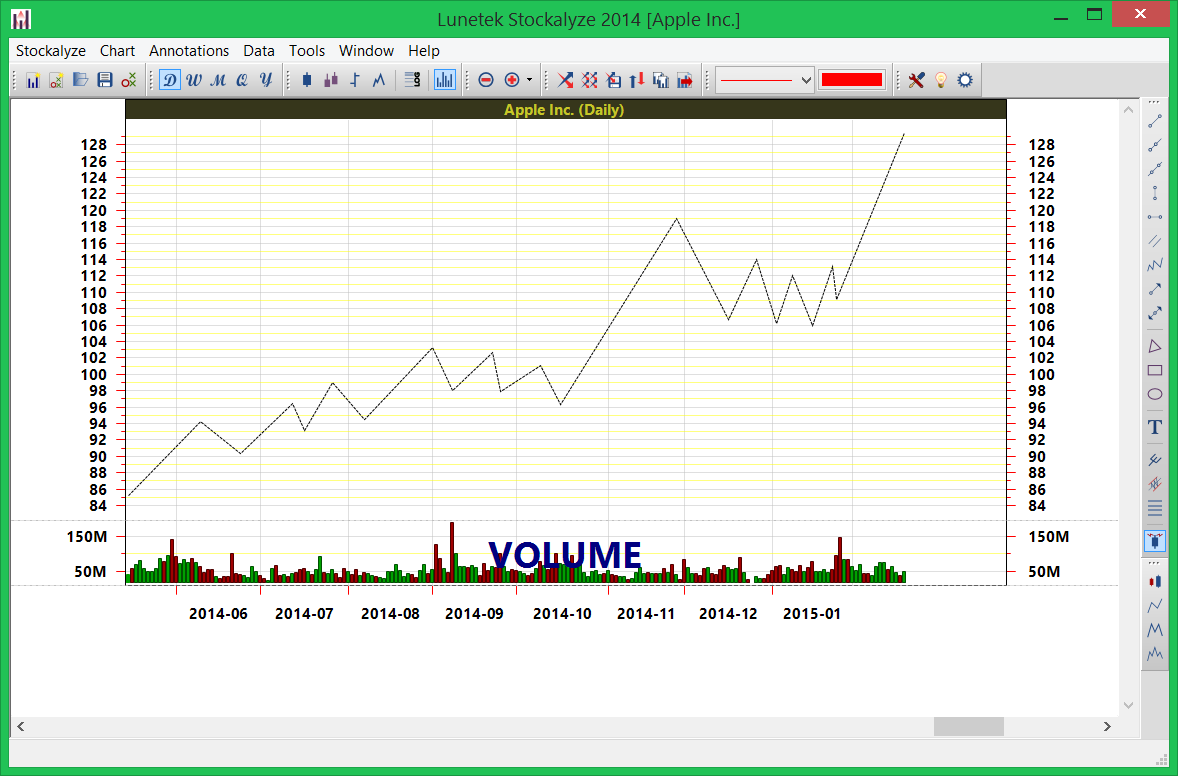
ZigZag pattern detection in stock price movement of AAPL.
Note: Graphics for Price is hidden to make zigzag appear clearer. You can hide price from stock chart by clicking selected chart style tool button again. Below image shows no chart-style is active and so no price data is shown on chart.

No chart style selected on toolbar.
Double top and double bottom:
To add double top and double bottom detector to chart you can choose the suitable menu item as described above or click on 'Detect double top and bottom patterns' tool button located on right side of chart:
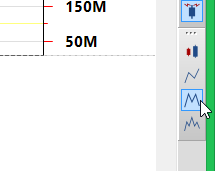
Double top detection tool.
Double Top detection configuration
When you click on tool button or menu item as described above then a configuration dialog will appear:
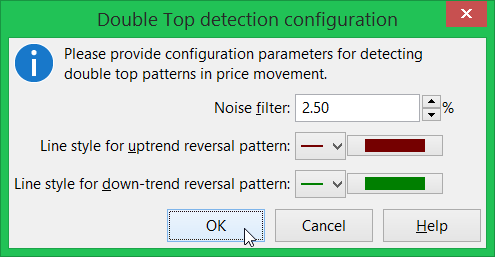
Double top detection configuration dialog.
You need to provide suitable noise filter and you can also choose colors to be used for detected patterns.
Example:
Below is the chart of SENSEX that shows a double bottom pattern detected on 2 March 2016 and then SENSEX skyrocketed to a new high.
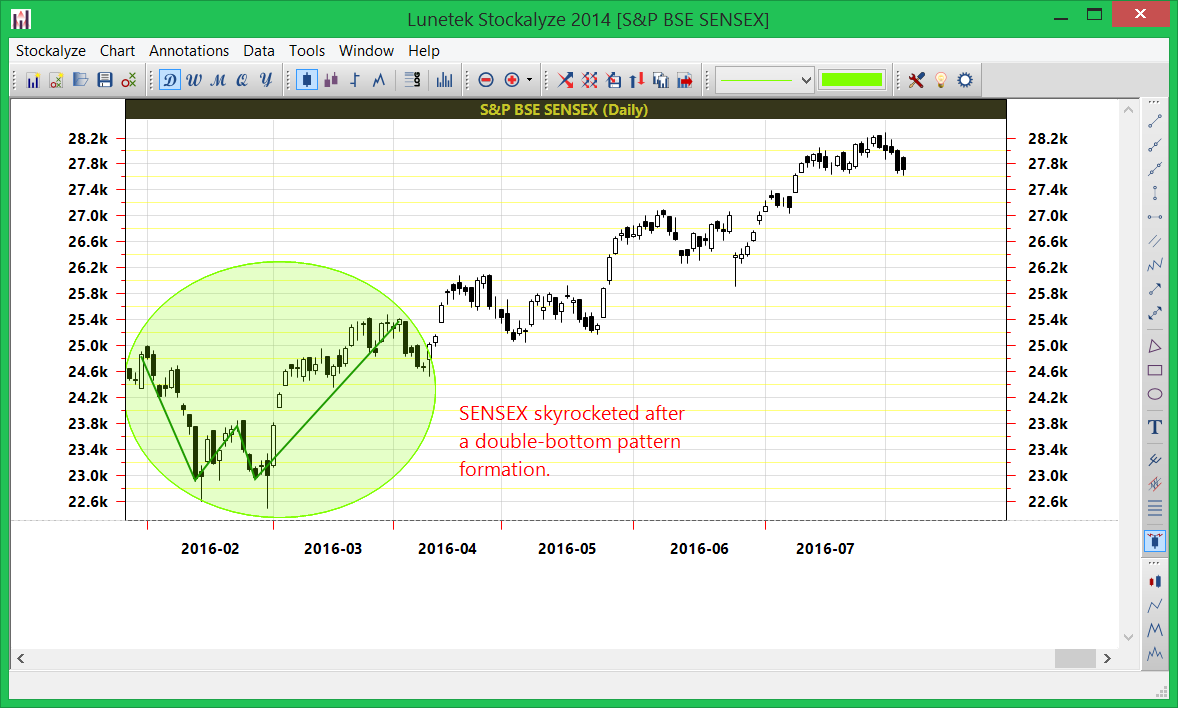
Double bottom pattern detection on SENSEX.
Head and shoulders:
To add head and shoulders detector to chart you can choose the suitable menu item as described above or click on 'Detect head and shoulders pattern' tool button located on right side of chart:
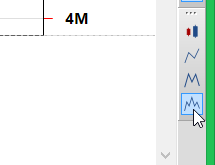
Head and shoulders patterns detection tool.
Head and Shoulders detection configuration:
When you click on tool button or menu item as described above then a configuration dialog will appear:
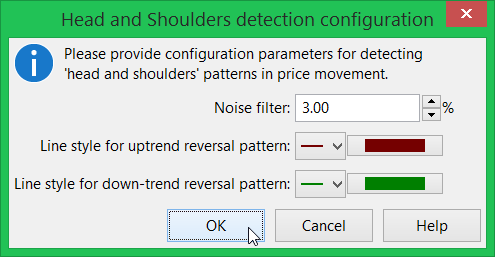
Head and Shoulders detection configuration dialog.
You need to provide suitable noise filter and you can also choose colors to be used for detected patterns.
Example:
Below is the image that shows head and shoulders pattern appearing on daily chart of ADBE.
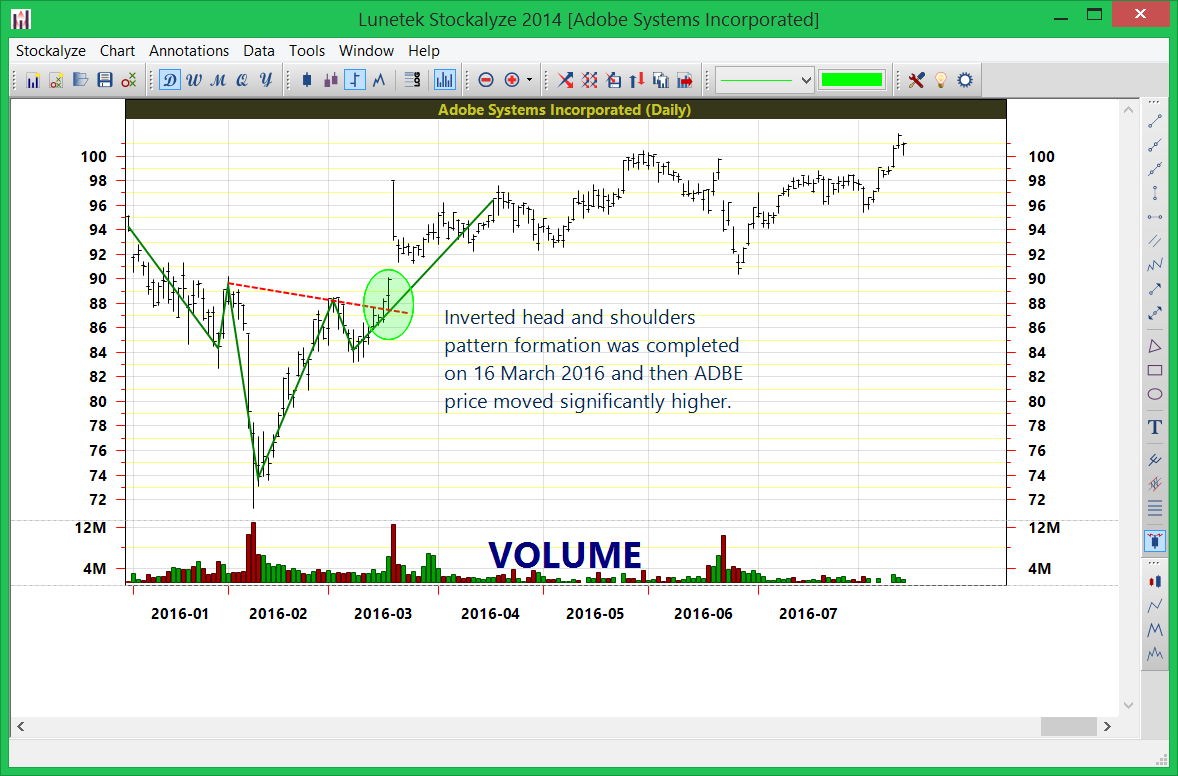
Head and shoulder pattern formation was complete on 16 March 2016 and then ADBE price moved significantly higher.
Related to Stock Chart
Signal Markers: Add buy/sell Signal Markers on chart.Security Selection Dialog: Details about Security Selection Dialog.
 Stockalyze Help Manual
 Forum
Forum